Download
1 / 34
340 likes | 350 Views
This article discusses the impacts of the El Niño weather phenomenon on corn production in Southern Africa, with a focus on the 2015/16 season. It examines the effects of reduced rainfall on crop yields and highlights the importance of timely precipitation for successful planting and crop emergence. The article also explores the role of USDA’s Foreign Agricultural Service in analyzing and providing data on global agricultural production and trade.

E N D
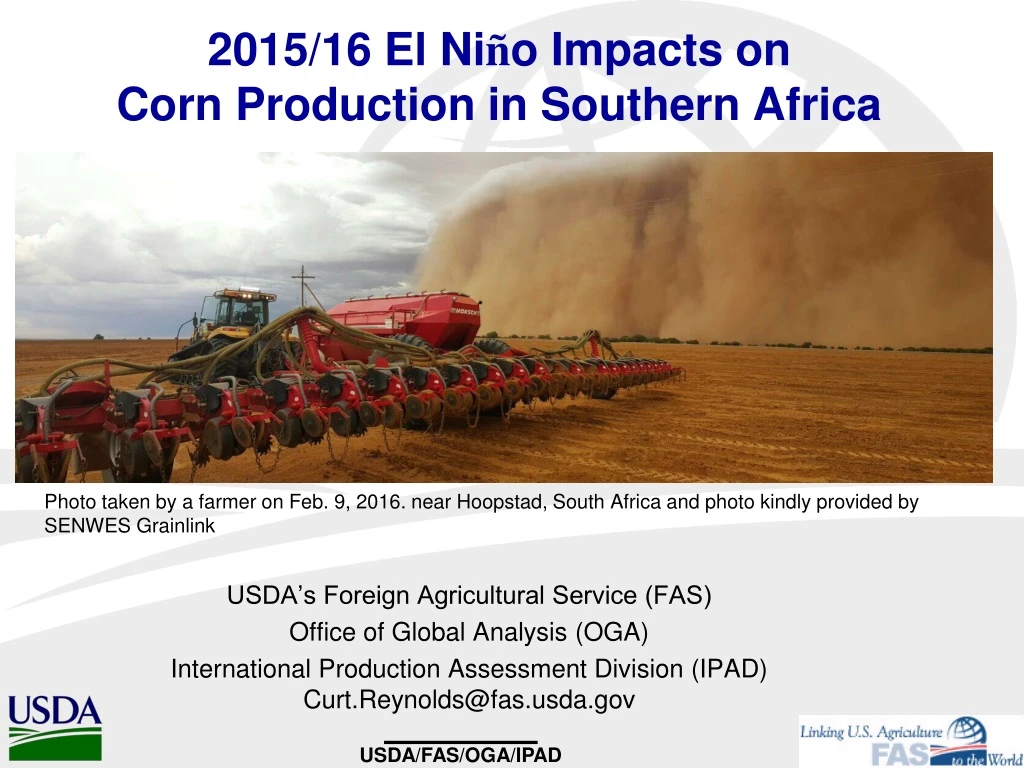
2015/16 El Niño Impacts on Corn Production in Southern Africa USDA’s Foreign Agricultural Service (FAS) Office of Global Analysis (OGA) International Production Assessment Division (IPAD) Curt.Reynolds@fas.usda.gov Photo taken by a farmer on Feb. 9, 2016. near Hoopstad, South Africa and photo kindly provided by SENWES Grainlink USDA/FAS/OGA/IPAD
Foreign Agricultural Service (FAS) of USDA • FAS is primarily responsible for USDA’s: • Overseas activities with attachés located at 75 posts • Market development & information, • International trade agreements and negotiations, • Collection and analysis of crop production and trade statistics. (PSD Online) Create economic opportunity for American agriculture by expanding global markets……… USDA/FAS/OGA/IPAD
Domestic Production and Stocks Estimates World Agricultural Supply and Demand Estimates (WASDE) FAS Commodity Circulars PSD (Production,Supply and Distribution)Online Data USDA’s Economic Intelligence System National Agricultural Statistics Service (NASS) Joint Agricultural Weather Facility (JAWF) Economic Research Service (ERS) Farm Service Agency (FSA) Foreign Agricultural Service (FAS) GLAM Crop Yield = MODISCrop Area = LandsatCrop Explorer Soil Moisture = SMAP Precipitation = CHIRPS/GPM Temperature= USAF 557th WWG-REALM Lake Water Heights = OSTM/Jason Crop Data Layer (CDL) from Landsat is released two months after harvest. USDA’s World Agricultural Outlook Board FAS/OGA manages PSD USDA’s WASDE Circular released to commodity markets and the public on the 9-12th day of each month at 12:00 noon EST.http://www.usda.gov/oce/commodity/wasde/ USDA/FAS/OGA/IPAD
WASDE (World Agricultural Supply & Demand Estimates) since 1973 USDA/FAS EconomicAnalysis USDA Publications PSD (Production, Supply & Distribution) Online Archive from 1960-current USDA’s Economic Intelligence System PSD Online stores historical estimates for crop production, imports, exports, consumption, & stocks for most commodities and countries. Chicago Board of Trade (CBOT) & other commodity markets • Trade Policy • Exporter Assistance & Export Programs • Food Aid & Export Credit Programs • UMR (Usual Marketing Requirements) • USDA decision-makers • U.S. Ag Producers & Traders • Commodity Price Discovery • Commodity Price Adjustments USDA/FAS/OGA/IPAD
USDA’s Economic Intelligence System USDA monthly crop estimates and trade reports are released every month: WASDE Circular from WAOB released on the 9-12th day of each month at 12:00 noon.http://www.usda.gov/oce/commodity/wasde/ Monthly World Production, Market and Trade Reports http://www.fas.usda.gov/currwmt.asp PSD Online (historical production & trade estimates from 1960) http://www.fas.usda.gov/psdonline/ USDA/FAS/OGA/IPAD
Next WASDE to be released on Friday, August 12, 2016 at 12 Noon • NASS releases first yield report for 2016 USA summer crops. • US summer crops need to survive next 4 weeks. • Good corn/soybean conditions during an election year. USDA/FAS/OGA/IPAD
Global Soybean Trade USDA/FAS/OGA/IPAD
Trans Pacific Partnership (TPP) at USDA/FAShttp://www.fas.usda.gov/tpp-benefits-us-agricultural-products USDA/FAS/OGA/IPAD
Trans Pacific Partnership (TPP) USDA/FAS/OGA
Southern Oscillation Index (SOI) ≈ PressureTahiti – PressureDarwin Normal Year El Niño Year Reverse Walker Circulation Cycle reverses direction during El Niño years and it is measured by SOI ≈PressureTahiti – PressureDarwin USDA/FAS/OGA
Nino 3.4 Region Oceanic Niño Index (ONI) is NOAA’s Operational Definition for El Niño
Rice, cotton, soybeans & grain yields down. Impacts occur during minor growing season. Rice & palm oil yields down. Corn yields down.. Winter grain yields down. Corn & soybean yields up.
El Niño Impact on SADC (Southern Africa Development Community) Region Actual Seasonal Percent of Normal Rainfall (%) El Niño Forecast(September 2015) (October 1- April 2, 2016) Source: USAID’s FEWSNET (Famine Early Warning Systems Network), Global Food Security Alert, Oct 8, 2015, Major corn production zone and region did not receive 45-mm rainfall for planting and crop emergence (i.e., bare soil in March, 2016). Percent of Normal Rainfall (%) Source: NOAA’s CPC http://www.cpc.ncep.noaa.gov/products/international/africa/africa.shtml USDA/FAS/OGA/IPAD
2015/16 El Niño Peaked in January 2016,Immediately after South Africa’s Planting Season 2015/16 El Niño peaked in Jan. 2016. Foreign Agricultural Service (FAS) Office of Global Analysis (OGA) International Production Assessment Division (IPAD) Source. ONI time series from NOAA's CPChttp://www.cpc.ncep.noaa.gov/data/indices/oni.ascii.txt
Standardized Precipitation Index (SPI)(Oct-Dec 2015) Minor growing season. Localized flood damage but “rain produces grain”. Main growing season. Source: SPI from CHIRPS (Climate Hazards Group InfraRed Precipitation with Station data) having 6-km resolution (1981-present) http://chg.geog.ucsb.edu/data/chirps/
Standardized Precipitation Index (SPI) (Oct. 1, 2015 – Mar. 31, 2016) Seasonal Rainfall Rank (Oct. 1, 2015 – Mar. 31, 2016) Foreign Agricultural Service (FAS) Office of Global Analysis (OGA) International Production Assessment Division (IPAD) Source: SPI & Rainfall Rank from CHIRPS (Climate Hazards Group InfraRed Precipitation with Station data) having 6-km resolution (1981-present) http://chg.geog.ucsb.edu/data/chirps/
Seasonal Rainfall Rank(Oct 1, 2015- Mar 31, 2016) District Corn Production Five provinces account for 91% of total production: Free State-37% North West-23%Mpumalanga-23% Gauteng -4% KwaZulu Natal-4% North West & Free State provinces typically plant ~2 MHa of corn. Source: District Corn Production from South Africa’s 2007 Ag Census Foreign Agricultural Service (FAS) Office of Global Analysis (OGA) International Production Assessment Division (IPAD)
Free State: Cumulative Rainfall (Oct.1, 2015 – April 30, 2016) Lowest cumulative rainfall over croplands since 1981. Foreign Agricultural Service (FAS) Office of Global Analysis (OGA) International Production Assessment Division (IPAD) Sources: CHIRPS (Climate Hazards Group InfraRed Precipitation with Station data ) with 6-km resolution http://chg.geog.ucsb.edu/data/chirps/ SPIRITS (Software for Processing and Interpreting Remote Sensing Image Time Series) http://spirits.jrc.ec.europa.eu/
Onset of Rains or Start of Season (SOS) SOS on Jan. 31 SOS on Dec. 31 SOS on Nov. 30 SOS = 25-mm (dekad1) + 20-mm (dekad2) SOS model triggered in November but crop “killed” 10-days later because it did not receive 20-mm of rainfall during dekad2. SOS = ~ Jan 31st Source: FEWSNET/USGS Data Portalhttp://earlywarning.usgs.gov/fews/africa/index.php
SOS Anomaly orEarly/Delayed Planting (January 10, 2016) Onset of Rains or Start of Season (SOS) (January 10, 2016) Month/Dekad “No start” region due to lack of rainfall (<45-mm during 30-days). Foreign Agricultural Service (FAS) Office of Global Analysis (OGA) International Production Assessment Division (IPAD) Source: FEWSNET Data Portalhttp://earlywarning.usgs.gov/fews/search/Africa/Southern%20Africa
NDVI-MODIS (May 7, 2016)(North West Province,23% Corn Production) Vegetation Conditions (NDVI) (Jan. 9-16 , 2016) Gauteng Mpumalanga North West KwaZulu Natal Free State Bare soils due to lack of rainfall (<45 mm in 30 days) from Oct-Dec 2015. NDVI Anomaly (NDVI Departure from Average: Jan. 9-16 , 2016) Gauteng Bare soil at end of January & planted area greatly reduced. Mpumalanga North West KwaZulu Natal Free State Bare soils due to lack of rainfall (<45 mm in 30 days) from Oct-Dec 2015. Foreign Agricultural Service (FAS) Office of Global Analysis (OGA) International Production Assessment Division (IPAD) Source: USDA/NASA’s Global Agriculture Monitoring (GLAM) Project http://glam1.gsfc.nasa.gov/
Western Free State, South Africa (Color Infrared- Landsat-7/8 Surface Reflectance Corrected Mosaics) ~Feb. 17, 2016 ~Feb. 17, 2015 Crop Density Bare soil from February-March 2016 in main corn belt. Mar 10, 2015 Mar 8, 2016 Landsat Source: GDA’s GeoSynergy; https://www.geosynergy.com/
Western Free State, South Africa (Color Infrared- Landsat-7/8 Surface Reflectance Corrected Mosaics) ~March 4, 2016 ~April 4, 2016 March 8, 2016 Bare soils Landsat Source:GDA’s GeoSynergyhttps://www.geosynergy.com
South Africa’s 2015/16 El Niño Drought Similar to US Prairie Dust Bowl during 1930’s Source: Photos taken by a farmer on Feb. 9, 2016. near Hoopstad, South Africa and sent to SENWES Public Relations office. Photos kindly provided by SENWES Grainlink. Foreign Agricultural Service (FAS) Office of Global Analysis (OGA) International Production Assessment Division (IPAD)
Small Corn Cobs in East and West Foreign Agricultural Service (FAS) Office of Global Analysis (OGA) International Production Assessment Division (IPAD)
Water Stressed Corn at Viljoenskroon, Free State, South Africa March 8, 2016 Foreign Agricultural Service (FAS) Office of Global Analysis (OGA) International Production Assessment Division (IPAD)
Late-planted Sunflower near Mooifontein, North West, South Africa March 8, 2016 Foreign Agricultural Service (FAS) Office of Global Analysis (OGA) International Production Assessment Division (IPAD)
Standardized Precipitation Index (SPI) Oct. 1 –Dec. 31, 2015 Jan. 1 – Mar. 31, 2016 Severe drought in North West & Free State provinces reduces planted area by 1 million hectares. Severe drought in North West & Free State provinces reduces yield by 63% from 5-year average. Oct. 1 –Dec. 31, 1991 Jan. 1 – Mar. 31, 1992 Foreign Agricultural Service (FAS) Office of Global Analysis (OGA) International Production Assessment Division (IPAD) Source: SPI from CHIRPS (Climate Hazards Group InfraRed Precipitation with Station data) having 6-km resolution (1981-present) http://chg.geog.ucsb.edu/data/chirps/
6MMT Below 5-yr Avg Total production of 6.5 MMT is not lowest level in recent past.
White Maize Prices Soar to Record Levels fromGlobal White Maize Shortage USDA/FAS/OGA/IPAD
SADC Food Security Challenges • South Africa will need to import ~4 MMT of corn and port capacity is approximately 4-5 MMT. • SADC region may need to import approximately 8 MMT of corn. • Import & transport challenges from now to next harvest (April 2017). • Grain transport to landlocked SADC countries (i.e., Zimbabwe) will be expensive • Food insecure population does not have cash reserves to purchase expensive grain. Major Ports in SADC Region USDA/FAS/OGA/IPAD