Download
1 / 29
290 likes | 306 Views
This article provides an overview of the demographic forecasts for Hudson Valley counties, including population trends, household forecasts, and employment projections. It also explores the impact of downtown revitalization and historic villages on the region's development. The forecasts are based on various models, including employment, population, labor force, and household formation. The article also compares national forecasts and examines the effects of the economic downturn on the region.

E N D
DEMOGRAPHIC FORECASTS FOR HUDSON VALLEY COUNTIES Magnetizing Downtowns and Historic Villages April 4th, 2009 Gerry Bogacz Planning Director New York Metropolitan Transportation Council
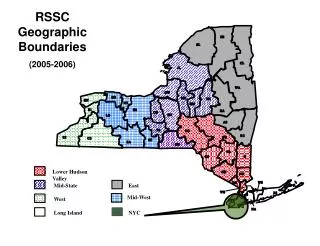
Transit Service New York Metropolitan Transportation Council Metropolitan Planning: An Overview Federal Authorizing Legislation Funding for Transportation Improvements Metropolitan Planning Organization Federal Investments in Transportation Improvements Roadway Improvements Transit Services Transportation Management
Defines the Funding Transportation Improvement Program Defines the Concepts Unified Planning Work Program Establishes Long-Range Concepts Regional Transportation Plan How the Process Operates Implementation Defines the Funding Transportation Improvement Program Defines the Concepts Unified Planning Work Program Establishes Long-Range Concepts Regional Transportation Plan
Background on NYMTC’s Forecasts • Four individual forecasting models are used: • Employment model • Population model • Labor force model • Household formation model • The employment model (which impacts the other models) is based on national forecasts
Background on NYMTC’s Forecasts (continued) • The population model is based on: • Historical/forecasted births and deaths from the census • Net-migration (in-migration minus out- migration) • The household model is based on age-specific household formation rates projected from the 2000 Census
Long Term National Forecasts • National forecasts of February 2007 by Global Insight • The forecasts includes a recession for the years 2008/2009 with recovery beginning in 2010.
Employment growth for 2007 to 2035 is 900,000 less than in the earlier forecast
Employment Change Among NY Metropolitan Counties (June 2007-June 2008) Data Source: Bureau of Labor Statistics, Data Accessed in March 2009
Weekly Wages Change Among NY Metropolitan Counties (June 2007-June 2008) Data Source: Bureau of Labor Statistics, Data Accessed in March 2009
2035 Population Trends Dutchess, Orange, Putnam, Rockland, Sullivan and Ulster Counties • Population growth in the six Hudson Valley counties (0.99% yearly) exceeds 31-county average growth rate (0.65%) • Natural increase leads, but strong employment outlook draws net in-migration • Births exceed deaths by 200,000; Net in-migration is nearly as large at 160,000 • The six counties will see growth among the number of seniors
Population Change for Age Group up to 19: 2005-2035 by County
Change in Distribution of Population by Race, Dutchess County: 2005-2035(in thousands)
Change in Distribution of Population by Race, Orange County: 2005-2035(in thousands)
Change in Distribution of Population by Race, Putnam County: 2005-2035(in thousands)
Change in Distribution of Population by Race, Rockland County: 2005-2035(in thousands)
Change in Distribution of Population by Race, Sullivan & Ulster County: 2005-2035(in thousands)
Household Forecast Dutchess, Orange, Putnam, Rockland, Sullivan and Ulster • Headship rates by age/sex/race-ethnicity for 2005 applied to demographic structure of future population • Yields 191,200 new households in the six-county region, growing at 1.2% yearly • Dutchess and Orange captures nearly 40% of the six-county growth, Sullivan and Ulster 47%; Rockland 6%, and Putnam nearly 5%
Job Growth Trends 2005-2035Dutchess, Orange, Putnam, Rockland, Sullivan and Ulster Counties • Total employment -- at 1.1% yearly, growth rate exceeds US & Region (0.9% yearly) • Strong performance due to Proprietors (1.8% yearly) • Payroll employment same as Nation’s growth (0.9% yearly) • Industry leaders -- Professional & Business Services, Personal Services, Transportation, Construction. • Industry losers – Manufacturing • Dutchess County grows faster than the 6-county region (1.1% yearly) • Orange falls behind 6-county region (0.8% yearly) • The others grow in pace with the region in payroll employment growth rate (0.9% yearly)