Download
1 / 8
80 likes | 93 Views
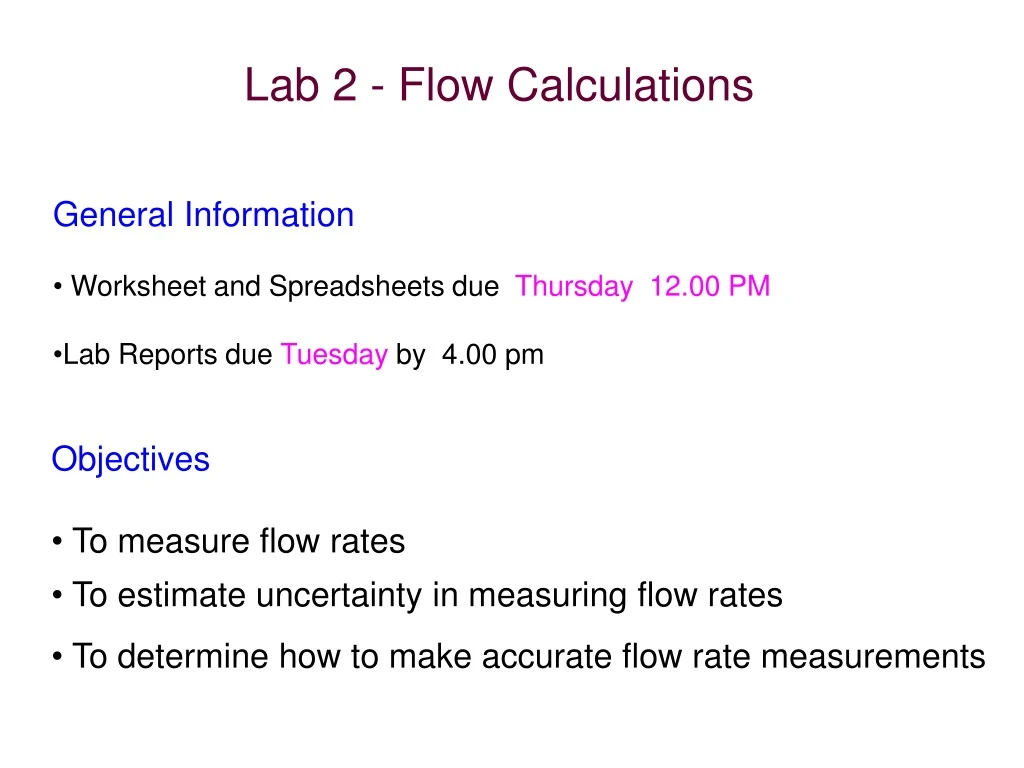
Lab 2 - Flow Calculations. General Information Worksheet and Spreadsheets due Thursday 12.00 PM Lab Reports due Tuesday by 4.00 pm. Objectives To measure flow rates To estimate uncertainty in measuring flow rates To determine how to make accurate flow rate measurements. Theory

E N D
Lab 2 - Flow Calculations • General Information • Worksheet and Spreadsheets due Thursday 12.00 PM • Lab Reports due Tuesday by 4.00 pm • Objectives • To measure flow rates • To estimate uncertainty in measuring flow rates • To determine how to make accurate flow rate measurements
Theory • Relationship between volume, time and flow rate ……………….(1) • Uncertainty Time • Ensure stopwatch is accurate to within 1% assuming the quartz • watch to be ‘correct’ • Estimate uncertainty by comparing the stopwatch with the lab clock ………..........(2)
Volume • Estimate the least count (Δ) of the site gage • Calculate uncertainty of site gage …………………………………….(3) Minimize other sources of uncertainty Human • Same person will be taking the time reading for the rest of the semester • Equipment : same hydraulic bench will be used for the rest of the semester
Analysis Calculate and plot the flow rates Estimate the uncertainties in your basic measurements Estimate the uncertainty in Q due to Uncertainties in V and T Explore the uncertainty in Q that is possible for different measurement situations Determine a method for measuring flow accurately in future experiments
For 1 , 2 & 3 : Tabulate and plot your readings Where , and
0.650 0.600 0.550 R = 1 Flow Rate ( L/S) R = 5 R = 10 0.500 0.450 0.400 0 2 4 6 8 10 12 Site Gage Reading (liters) Flow Rate vs Site Gage Reading Figure 1. Replicate Flow Rate
For 4 & 5, you have to determine for what volume will your uncertainty be less than 5% for maximum flow rate (we will assume values with uncertainty less than 5% are considered accurate)
Definition • You can do this by extrapolating the uncertainty in Q * i, j is the row and column respectively Least count --- the smallest change in volume that you can reliably identify using the site gage