Download
1 / 28
280 likes | 452 Views
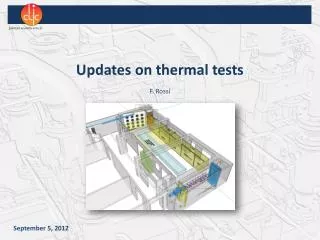
Updates on thermal tests. F. Rossi. September 5, 2012. EXPERIMENTAL PROGRAM FOR THERMAL TESTS. ALL THE TESTS ARE PERFORMED WITH NO VACUUM. STEP 1 – Heating environment. STEP 0 – Alignment tests. STEP 2 – Heating only PETS. ENVIRONMENT T amb = 20 - 40 ° C

E N D
Updates on thermal tests F. Rossi September 5, 2012
EXPERIMENTAL PROGRAM FOR THERMAL TESTS ALL THE TESTS ARE PERFORMED WITH NO VACUUM STEP 1 – Heating environment STEP 0 – Alignment tests STEP 2 – Heating only PETS ENVIRONMENT Tamb = 20 - 40 °C in steady-state conditions and by steps of 5 °C • MEASUREMENTS • Temperature • Alignment • Laser tracker • Romer arm • WPS • Micro-Triangulation system ENVIRONMENT Tamb = 20 °C in steady-state conditions • MEASUREMENTS • Temperature • Volumetric flow rate • Alignment • Laser tracker • Romer arm • WPS • Micro-Triangulation system ENVIRONMENT Tamb = 20 & 40 °C MEASUREMENTS Comparison between laser tracker and WPS measurements (no movements of girders) Alignment tests by moving girders via actuators and comparison between laser tracker and WPS measurements HEATING PETS by steps up to 110 W/unit HEATING No active heating in RF structures COOLING PETS < max calculated T COOLING No active cooling in RF structures STEP 3 – Heating only AS STEP 4 – Heating all module ENVIRONMENT Tamb = 20 °C in steady-state conditions • MEASUREMENTS • Temperature • Volumetric flow rate • Alignment • Laser tracker • Romer arm • WPS • Micro-Triangulation system ENVIRONMENT Tamb = 20 - 40 °C in steady-state conditions and by steps of 5 °C • MEASUREMENTS • Temperature • Volumetric flow rate • Alignment • Laser tracker • Romer arm • WPS • Micro-Triangulation system HEATING AS + PETS + DBQ by steps up to max power/unit HEATING AS by steps up to 400 W/unit COOLING AS < max calculated T COOLING AS + PETS + DBQ < max calculated T
Topics and updates concerning the status of: • CLIC prototype module type 0 • Laboratory environment (air conditioning, ventilation, etc. ) • Heating system (heaters, temperature sensors, etc.) • Cooling system (water supply, inlet/outlet cooling circuits, control valves, etc.) • Numerical simulations
1. CLIC prototype module type 0 • First module type 0 ready by the end of September (RF network, vacuum network, compact load, cooling system inside module, etc. )
2. LABORATORY ENVIRONMENT: air conditioning and ventilation system • Air conditioning and ventilation system to reproduce thermal conditions inside CLIC tunnel • Installation: end of October 2012 • Cupboards inside and outside experimental area are being moved to bld. 162 T = 20 - 40 °C v = 0.2 - 0.8 m/s AIR CIRCULATION (v = 4 m/s) AIR COOLING
3. HEATING SYSTEM: heaters G. Riddone, A. Samoshkin, CLIC Test Module meeting 25.07.2011 • Experimental conditions to be reproduced: DBQ heaters AS + PETS heaters
3. HEATING SYSTEM: temperature sensors PWM signal for controlling the heaters Duty cycle (%) solid state relay T = 10 s heaters 1 DOF for each heating sub-system (AS, PETS and DBQ) temperature sensors max. temp. limit: 50 °C Hardware thermal interlock (2 for AS, 1 for each PETS and DBQ) IL All temperature sensors are currently stored in the lab
3. HEATING SYSTEM: temperature sensors • 5 thermocouples for each section • Thermocouple type T (± 0.5 °C) • 15 thermocouples in total • Continuous acquisition during tests 1.2 m 1 m 1.3 m 2 m NI 9214 16-Channel Isothermal Thermocouple Input Module
3. HEATING SYSTEM: software • Modifications to the previous configuration are being integrated in the software Software interface Panel for control valves
3. HEATING SYSTEM: status • Heaters: DELIVERED • RTD sensors: DELIVERED • NI hardware: DELIVERED • Thermocouples + DAQ card: mid of September • Electric scheme (IL, SSR, etc.): end of September
4. COOLING SYSTEM • Demineralized water • Nominal volumetric flow rate: 0.36 m3/h • Water inlet temperature: 25 °C • Water outlet temperature: ~45 °C • Max. pressure allowed: 5 bar
4. COOLING SYSTEM: AS TS7 TS6 TS4 TS1 TS2
4. COOLING SYSTEM: PETS TS23 TS24 TS22 TS25 TS26 TS17
4. COOLING SYSTEM: hydraulic circuit safety valves control valves pressure transducer PRV flow (+temperature) transducer Temperature regulator POWER SOCKET Max. 32 A Heat exchanger inlet/outlet hydraulic circuit Inlet/outlet port POWER SOCKET Max. 16 A Water tank Water pump air cooling
4. COOLING SYSTEM: status • Water supply: DELIVERED • Hydraulic parts (pipes, elbows, etc. ): DELIVERED • Control valves: DELIVERED • Measuring devices (pressure transducer, flow rate transducer, etc. ): DELIVERED • PRV: DELIVERED • Safety valves: end of September • Supporting frames (beams, ladders, etc. ): end of September • Electric scheme: end of September
FINAL LAYOUT • Improvement of current electric network of Lab completed • Supporting system for: • Control valves (q.ty 7) • Flow transducer (q.ty 1) • Pressure sensor (q.ty 1) • Electric scheme for control valves, heaters, temperature sensors, etc. (J. Blanc) SSR POWER SOCKET Max. 63 A POWER SOCKET Max. 63 A DBQ heaters PETS heater AS heater Temperature sensors (q.ty 29) POWER SOCKET Max. 32 A POWER SOCKET Max. 16 A • CUPBOARD for: • NI cDAQ-9178 8 slots (q.ty 1) • NI cDAQ-9174 4 slots (q.ty 1) • 24 V supply • Digital control electronics for proportional valves (q.ty 7)
SCHEDULE • End of September: • 1st TM0 ready • End of October: • Installation of air conditioning and ventilation system • Preliminary tests for heaters, cooling system and data acquisition process • Beginning of November: • Preliminary thermal tests
5. NUMERICAL SIMULATIONS: thermo-mechanical modelling Resulting temperatures inside the modules Deformed shape of prototype module type 0 due to applied thermal RF loads (values in µm) Resulting displacements on the DB and MB lines due to thermal, vacuum and gravity loads (SAS = 820 W, PETS unit = 78 W, Tamb = 25 °C) R. Raatikainen
5. NUMERICAL SIMULATIONS: hydraulic circuit modelling EDMS 1233096 CV1 L11, J11 Q11 CLs SAS CV2 L12, J12 Q12 CLs SAS CV3 L13, J13 Q13 CLs SAS CV4 PUMP Q14 L14, J14 CV7 CLs SAS PRV Q PPRV CV5 Q2 L2, J2 PETS unit WG1 WG2 PETS unit WG3 WG4 Q = total flow rate [m3/h] Q1i = flow rate for SAS [m3/h] Q2 = flow rate for PETS unit [m3/h] PPRV = set pressure for PRV [bar] CV = control valve PUMP = water pump Ji = pipe distributed energy loss (Li = pipe length) SAS = super accelerating structure CL = compact load WG = waveguide
5. NUMERICAL SIMULATIONS: hydraulic circuit modelling CHARACTERISTICS OF PROPORTIONAL VALVES kVs value: Flow rate value for water, measured at +20 °C and 1 bar pressure differential over a fully opened valve kV = flow coefficient for a certain opening position of control valve V = input voltage signal for control valve [0 - 10 volt] Δp = pressure drop across control valve for a certain opening position [bar] ρ = water density [kg/dm3]
5. NUMERICAL SIMULATIONS: hydraulic circuit modelling Dependent variables (calculated) Independent variables *all pressure values are relative to the atmospheric pressure
5. NUMERICAL SIMULATIONS: CFD model of air conditioning and ventilation system • Total RF power per module: 4 kW • Number of modules: 4 • Assumptions per module: • Heat dissipation to cooling system: 80 % (3200 W) • Heat dissipation to air: 20 % (800 W)
5. NUMERICAL SIMULATIONS: CFD model of air conditioning and ventilation system TM0 (2 x 1 x 1 m) 2 m 14.6 m 4.6 m Lab volume Vertical cutview 2.3 m vx = 0.5 m/s Ti = 20 °C vz = 0 (no-penetration condition) • Initial temperature = 25 °C • Time period = 300 s vy = 0 (no-penetration condition) vx = 0.5 m/s x y z
5. NUMERICAL SIMULATIONS: CFD model of air conditioning and ventilation system Ti = 20 °C vx = 0.5 m/s Q = 800 W T = 20 °C T = 23 °C
5. NUMERICAL SIMULATIONS: CFD model of air conditioning and ventilation system Ti = 30 °C vx = 0.7 m/s Q = 1600 W T = 30 °C T = 35 °C
THERMAL TESTS: people • Shoaib Azhar • Design and modelling of cooling system • Roberto Mondello • Experimental tests • Lauri Kortelainen • FEA analysis of thermo-mechanical behaviour of CLIC modules • CFD analysis • Ioannis Kossyvakis • Software and data acquisition • Jeremy Blanc • Electric design of data acquisition and control system • Anastasia Xydou • Theoretical and experimental investigation on the bonding/brazing process
NEXT CLIC TEST MODULE MEETINGS • CLIC Test Module Meeting (19.09.2012) • A. Schoaib: "Modelling of hydraulic system of CLIC prototype type 0" • CLIC Test Module Meeting (03.10.2012) • CLIC Test Module Meeting (17.10.2012) • CLIC Test Module Meeting (31.10.2012) • CLIC Test Module Meeting (14.11.2012) • CLIC Test Module Meeting (28.11.2012) • CLIC Test Module Meeting (12.12.2012)