Download
1 / 85
850 likes | 1.07k Views
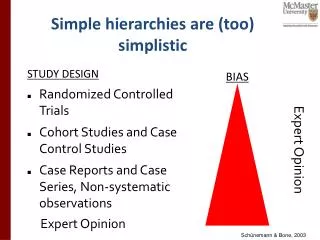
Simple hierarchies are (too) simplistic. STUDY DESIGN Randomized Controlled Trials Cohort Studies and Case Control Studies Case Reports and Case Series, Non-systematic observations. BIAS. Expert Opinion. Expert Opinion. Schünemann & Bone, 2003. Likelihood of and confidence in an outcome.

E N D
Simple hierarchies are (too) simplistic • STUDY DESIGN • Randomized Controlled Trials • Cohort Studies and Case Control Studies • Case Reports and Case Series, Non-systematic observations BIAS Expert Opinion Expert Opinion Schünemann & Bone, 2003
Determinants of confidence • RCTs • observational studies • 5 factors that can lower quality • limitations in detailed study design and execution (risk of bias criteria) • Inconsistency (or heterogeneity) • Indirectness (PICO and applicability) • Imprecision • Publication bias • 3 factors can increase quality • large magnitude of effect • opposing plausible residual bias or confounding • dose-response gradient
Design and Execution/RoB From Cates , CDSR 2008
Design and Execution/RoB Overall judgment required
Who believes the risk of bias is of concern? Yes No Don’t know or undecided
Detailed study design and execution Mortality, cancer and anticoagulation Akl E, Barba M, Rohilla S, Terrenato I, Sperati F, Schünemann HJ. “Anticoagulation for the long term treatment of venous thromboembolism in patients with cancer”. Cochrane Database Syst Rev. 2008 Apr 16;(2):CD006650.
Who believes the risk of bias is of concern? Yes No Don’t know or undecided
2. Inconsistency of results(Heterogeneity) • if inconsistency, look for explanation • patients, intervention, comparator, outcome • if unexplained inconsistency lower quality
Inconsistency • I2 • P-value • Overlap in CI • Difference in point estimates
3. Directness of Evidencegeneralizability, transferability, applicability • differences in • populations/patients (HIC – L/MIC, patients with HIV – all patients) • interventions (new fluroquinolones - old) • comparator appropriate (newer antibx – old) • outcomes (important – surrogate; signs and symptoms – mortality) • indirect comparisons • interested in A versus B • have A versus C and B versus C • Cryo + antibiotics versus no intervention versus Cryo versus no intervention
EVIDENCE PROFILE Question: Cyrotherapy with antibiotics vs no antibiotics for histologically confirmed CIN 1 All rates presented at 12 months with assumption that events would occur within this time frame.2 Indirect analysis between single arm observational studies
4. Publication Bias • Should always be suspected • Only small “positive” studies • For profit interest • Various methods to evaluate – none perfect, but clearly a problem
ISIS-4Lancet 1995 I.V. Mg in acute myocardial infarction Meta-analysisYusuf S.Circulation 1993 Publication bias Egger M, Smith DS. BMJ 1995;310:752-54
Funnel plot 0 Symmetrical: No publication bias 1 Standard Error 2 3 0.1 0.3 0.6 1 3 10 Odds ratio Egger M, Cochrane Colloquium Lyon 2001
Funnel plot 0 Asymmetrical: Publication bias? 1 0.4 Standard Error 2 3 0.1 0.3 0.6 1 3 10 Odds ratio Egger M, Cochrane Colloquium Lyon 2001
5. Imprecision • Small sample size • small number of events • Wide confidence intervals • uncertainty about magnitude of effect
For systematic reviews • If the 95% CI excludes a relative risk (RR) of 1.0 and the total number of events or patients exceeds the OIS criterion, precision is adequate. If the 95% CI includes appreciable benefit or harm (we suggest a RR of under 0.75 or over 1.25 as a rough guide) rating down for imprecision may be appropriate even if OIS criteria are met.
Optimal information size • We suggest the following: if the total number of patients included in a systematic review is less than the number of patients generated by a conventional sample size calculation for a single adequately powered trial, consider rating down for imprecision. Authors have referred to this threshold as the “optimal information size” (OIS)
What can raise quality? 1. large magnitude can upgrade (RRR 50%/RR 2) • very large two levels (RRR 80%/RR 5) • criteria • everyone used to do badly • almost everyone does well • parachutes to prevent death when jumping from airplanes
What can raise quality? 2. dose response relation • (higher INR – increased bleeding) • childhood lymphoblastic leukemia • risk for CNS malignancies 15 years after cranial irradiation • no radiation: 1% (95% CI 0% to 2.1%) • 12 Gy: 1.6% (95% CI 0% to 3.4%) • 18 Gy: 3.3% (95% CI 0.9% to 5.6%) 3. all plausible residual confounding may be working to reduce the demonstrated effect or increase the effect if no effect was observed
All plausible residual confoundingwould result in an overestimate of effect • Hypoglycaemic drug phenformin causes lactic acidosis • The related agent metformin is under suspicion for the same toxicity. • Large observational studies have failed to demonstrate an association • Clinicians would be more alert to lactic acidosis in the presence of the agent • Vaccine – adverse effects
Overall quality of a body of evidence • The quality of evidence reflects the extent of our confidence that the estimates of an effect are adequate to support a particular decision or recommendation. • Guideline developers must specify and determine importance of all relevant outcomes • Overall quality of evidence is based on the lowest quality of all critical outcomes
Meta-analyses of several critical and important outcomes (one PICO) High Mortality (critical) Myo. Infarct. (critical) Moderate Due to imprecision Nausea (important) Low Due to imprecision and risk of bias High SAE (critical) 0.5 0.75 1 1.25 1.5 Better Relative Risk Worse Overall Quality of Evidence: Moderate based on critical outcomes Low
Meta-analyses of several critical outcomes (one PICO) Threshold of acceptable harm for strong recommendation based on sure benefit in mortality and stroke High Mortality Dis. Specific QoL Moderate Due to imprecision Stroke High High SAE 0.5 0.75 1 1.25 1.5 Better Relative Risk Worse Overall Quality of Evidence: High
Meta-analyses of several critical outcomes (one PICO) Threshold of acceptable harm for strong recommendation based on sure benefit in mortality and stroke High Mortality Dis. Specific QoL High Stroke Moderate due to risk of bias High SAE 0.5 0.75 1 1.25 1.5 Better Relative Risk Worse Overall Quality of Evidence: Moderate
Interpretation of grades of evidence • /A/High: Further research is very unlikely to change confidence in the estimate of effect. • /B/Moderate: Further research is likely to have an important impact on confidence in the estimate of effect and may change the estimate. • /C/Low: Further research is very likely to have an important impact on confidence in the estimate of effect and is likely to change the estimate. • /D/Very low: We have very little confidence in the effect estimate: Any estimate of effect is very uncertain.
Agenda 8.30-8.45 Introduction to the course 8.45-9.15 Overview of guideline development 9.15-10.15 The GRADE approach: introduction 10.15-10.30 Break 10.30-11.30 Asking a key question, specific outcomes – small group work 11.30-12.30 The GRADE approach: assessing the quality of evidence 12.30-13.15 Lunch 13.15-14.45 Grading quality of evidence – small group work 14.45-15.15 Moving from evidence to recommendations: theoretical considerations 15.15-15.30 Break 15.30-16 Making recommendations – small group work 16-16.30 Report from small groups and practical considerations of group process
Agenda 8.30-8.45 Introduction to the course 8.45-9.15 Overview of guideline development 9.15-10.15 The GRADE approach: introduction 10.15-10.30 Break 10.30-11.30 Asking a key question, specific outcomes – small group work 11.30-12.30 The GRADE approach: assessing the quality of evidence 12.30-13.15 Lunch 13.15-14.45 Grading quality of evidence – small group work 14.45-15.15 Moving from evidence to recommendations: theoretical considerations 15.15-15.30 Break 15.30-16 Making recommendations – small group work 16-16.30 Report from small groups and practical considerations of group process
Holger (contributions from YngveFalck-Ytter) Moving from evidence to recommendations
Strength of recommendation “The strength of a recommendation reflects the extent to which we can, across the range of patients for whom the recommendations are intended, be confident that desirable effects of a management strategy outweigh undesirable effects.” • Strong or conditional
Evidence based healthcare decisions Population/societal values and preferences (Clinical) state and circumstances Expertise Research evidence Haynes et al. 2002
Evidence based healthcare decisions Population/societal values and preferences Evidence of baseline risk and context for a given population Expertise Research evidence Schunemann et al. in prep
Evidence based healthcare decisions Evidence of population & societal values & preferences Evidence of baseline risk and context for a given population Expertise Research evidence Schunemann et al. in prep
Evidence based healthcare decisions Evidence of population & societal values & preferences Evidence of baseline risk and context for a given population Expertise Evidence of effects Schunemann et al. in prep
Evidence based healthcare decisions Evidence of population & societal values & preferences Evidence of baseline risk and context for a given population Expertise Evidence of effects Schunemann et al. in prep
From evidence to recommendations Balance between benefits, harms & burdens RCT Obser-vational study Quality of evidence Patients’ values & preferences Resource use High level recommen-dation Lower level recommen-dation GRADE Old system
Balancing desirable and undesirable consequences Effects & $ x values Effects & $ x values Conditional Strong For Against
Balancing desirable and undesirable consequences Effect x value Effect x value ↑ Resources ↑ Nausea ↑ herd immunity ↓ Morbidity ↑ Local skin reactions ↑ Allergic reactions ↓ Death ↑ QoL Conditional Strong For Against
Balancing desirable and undesirable consequences ↑ Resources ↑ Nausea ↑ herd immunity ↓ Morbidity ↑ Local skin reactions ↑ Allergic reactions ↓ Death ↑ QoL Conditional Strong For Against