Download
1 / 19
210 likes | 469 Views
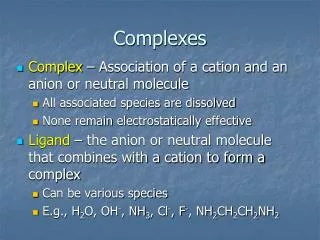
EPR Study of Vanadyl Complexes. Experimental Objectives. To synthesize to vanadyl complexes Vanadyl acetylacetonate Bis(O,O’-diethyldithiophosphato)oxovanadium (IV) Compare the EPR spectra of the two complexes

E N D
Experimental Objectives • To synthesize to vanadyl complexes • Vanadyl acetylacetonate • Bis(O,O’-diethyldithiophosphato)oxovanadium (IV) • Compare the EPR spectra of the two complexes • Observe how the variations in the chemical environment affect the spectrum of the same d1 system
Pb5(VO4)3Cl V V2O5 VOSO4 Chemistry of Vanadium • First discovered by A.M. del Rio (1801) • Rediscovered by N.G. Sefström (1830) • Named for Vanadis • Natural abundance ~0.014% • 19th most abundant element • 5th most abundant transition metal • Primary industrial use is in alloy steels and cast iron • Adds ductility and shock resistance • Iron alloy, ferrovanadium • Formal oxidation states -1 to +5
VOSO4 Vanadium(IV) • Chemistry is dominated by formation of oxo species • Vanadyl ion, VO2+ • Often a result of hydrolysis of other VIV compounds • Usually blue to green • Form stable complexes with F, Cl, N and O ligands • Frequently 5 coordinate and square pyrimidal • Many compounds containing the vanadyl unit have two characteristic features: • EPR spectrum • Characteristic g values • 51V hyperfine coupling • Strong V=O stretching band A brief review of EPR spectroscopy… VO(acac)2 Acta Crystallogr., Sect. C: Cryst. Struct. Commun.1995, C51, 12-14
ESR Spectroscopy • Electron Spin Resonance Spectroscopy • Also called EPR Spectroscopy • Electron Paramagnetic Resonance Spectroscopy • Applicable for species with one or more unpaired electrons • ESR measures the transition between the electron spin energy levels in a magnetic field • Transition induced by the appropriate frequency radiation • Required frequency of radiation dependent upon strength of magnetic field • Common field strengths 9.5 and 35 GHz (microwave region) • Important features of the spectrum • Proportionality factor, g • Hyperfine interactions
Proportionality Factor • Measured from the center of the signal • g = • For a free electron • 2.00232 • For organic radicals • Typically close to free- electron value • 1.99-2.01 • For transition metal compounds • Large variations due to spin-orbit coupling and zero-field splitting • 1.4-3.0
Hyperfine Interactions • EPR signal is ‘split’ by neighboring nuclei • Called hyperfine interactions • Provides information about number and identity of nuclei and their distance from unpaired electron • Selection rules same as for NMR • Every isotope of every element has a ground state nuclear spin quantum number, I • has value of n/2, n is an integer • Isotopes with even atomic number and even mass number have I = 0, and have no EPR spectra • 12C, 28Si, 56Fe, … • Isotopes with odd atomic number and even mass number have n even • 2H, 10B, 14N, … • Isotopes with odd mass number have n odd • 1H, 13C, 19F, 55Mn, …
Hyperfine Interactions • Coupling patterns (or splitting) same as in NMR • More common to see coupling to nuclei with I > ½ • The number of lines = 2NI + 1 • Only determines the number of lines--not the intensities • Relative intensities determined by the number of interacting nuclei • If only one nucleus interacting • All lines have equal intensity • If multiple nuclei interacting • Distributions derived based upon spin • For spin ½ (most common), intensities follow binomial distribution
Hyperfine Interactions • Coupling to several sets of nuclei • First couple to the nearest set of nuclei • Largest a value • Split each of those lines by the coupling to the next closest nuclei • Next largest a value • Continue 2-3 bonds away from location of unpaired electron
Hyperfine Interactions • Example: • Pyrazine anion • Electron delocalized over ring • Exhibits coupling to two equivalent N (I = 1) 2NI + 1 = 2(2)(1) + 1 = 5 • Then couples to four equivalent H (I = ½) 2NI + 1 = 2(4)(1/2) + 1 = 5 • So spectrum should be a quintet with intensities 1:2:3:2:1 and each of those lines should be split into quintets with intensities 1:4:6:4:1
Hyperfine Interactions EPR spectrum of pyrazine radical anion
Begin synthesis of VO(dtp)2 While cooling, synthesize VO(acac)2 Collect both complexes Determine IR spectra EPR spectra Experiment Overview
Safety/Tips 19 Dispose of all waste in the appropriately labeled waste containers – do not throw solutions down the drain Wear your safety glasses at all times If you should get any reagents on your skin, rinse with plenty of water and tell your TA Be sure VOSO4 is completely dissolved before adding ligand VO(acac)2 – add NaHCO3 slowly with vigorous stirring