Download
1 / 20
210 likes | 410 Views
Isotope Ratio Performance of an Axial Time of Flight ICP-MS. Stuart Georgitis 1 , Lloyd Allen 1 , and Janos Fucsko 1 , Frank Vanhaecke 2 1 LECO Corporation 2 University of Ghent. Introduction. Nature of noise in ICP-MS measurement

E N D
Isotope Ratio Performance of an Axial Time of Flight ICP-MS Stuart Georgitis1, Lloyd Allen1, and Janos Fucsko1, Frank Vanhaecke2 1LECO Corporation 2University of Ghent
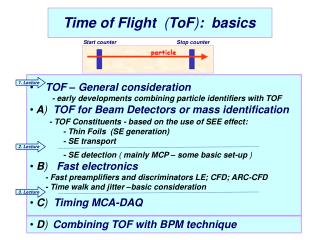
Introduction • Nature of noise in ICP-MS measurement • Sequential and simultaneous detection: fundamental differences in signal ratios • Axial TOF ICP-MS: Is it really better for isotope ratio determinations • Isotope ratios of transient and steady state signals with liquid and solid sampling methods • Characterization of TOF ICP-MS performance • Limitations of measurements
Isotope Ratio Fundamentals • Sources of Noise in ICP-MS • Flicker Noise: Non Fundamental, Caused by Sample Introduction system and ICP. sa s • Shot Noise: Fundamental, Due to the Random Arrival Rate of Particles (photons, electrons, ions) at a detector. sa s1/2
Isotope Ratios • 50 ng/mL Ag • 30 min. period • Each point • 5 repetitions • 10 s integration/repetition • Relative Standard Deviation (%) • 107Ag: 0.18% • 109Ag: 0.17% • 107Ag/109Ag: 0.02%
Isotope Ratios • Do you need simultaneous techniques to measure? • How is signal to noise ratio improved? • Examples for solution and for solid material sampling.
Isotope Ratio Fundamentals • Flicker Noise can be minimized or eliminated by ratio pairing. Flicker noise elimination is most effectively done using simultaneous acquisition. • Should Flicker noise be eliminated, shot noise should be the dominant remaining source of noise.
Isotope Ratio Fundamentals • The theoretical shot noise limit can be calculated: RSD = (s/s) at the Shot Noise Limit s = s1/2 RSD = s-1/2 RSD2A/B = RSD2A + RSD2B or RSD2A/B = sB-1 + sB-1
Solid Sample Isotope Ratios206Pb/207Pb in NIST Glass Conc (ppm) RSD Signal RSD Ratio 2.32 19% 0.8% 38.57 10% 0.2% 426 3.5% 0.09% 10 second integration n = 10
Transient Signal Isotope Ratio Precision 120 100 80 Signal (mV) Ag107 60 Ag109 40 20 10 15 20 25 30 35 40 45 50 Time (s)
Transient Signal Isotope Ratio Precision* Ratio 5 ng (%RSD) 50 ng (%RSD) Ag (107/109) 0.23 0.04 Ba (138/137) 0.31 0.10 Cu (63/65) 0.21 0.12 Pb (208/207) 0.48 0.04 Pb (208/206) 0.48 0.10 Pb (206/207) 0.36 0.12 Zn (64/66) 0.63 0.07 *10 ml Injection n = 5
Isotope Ratio Precision 0.75 0.70 0.65 Pb-208 = 1.3 % Peak Area Ratio Pb-206 = 1.3 % 0.30 0.48 0.47 0.46 0.45 Ratio Precision = 0.34% 0.44 0.43 0.42 0 5 10 15 20 Time (min)
Isotope Ratio Precision(%RSD) 50mg/L 208/206 208/207 206/207 63/65 0.07% 0.11% 0.09% 0.10% 500mg/L 208/206 208/207 206/207 63/65 0.06% 0.05% 0.02% 0.05% 30 Second Integration Time n=10
Isotope Ratio Limitations Simultaneous Techniques • Even at the Shot noise limit, practical limitations arise • In order to obtain a %RSD of 0.01 on a 1:1 Ratio, 200 Million counts must be accumulate • In order to obtain a %RSD of 0.001 on a 1:1 Ratio, 20 Billion counts must be accumulated • Ultimately, detector saturation limits the overall count rate which can be tolerated and integration for infinite time (2000 s/rep) is not possible
Silver Isotope Ratios %RSD vs Concentration Figure6 0.06% RSD, 100 ppb n = 10 107Ag/109Ag
1 mg/L Steady State Solution Nebulization, %RSD vs Integration Time Figure 9 207Pb/206Pb
1 mg/L Steady State Solution Nebulization, %RSD vs Integration Time Figure 8 107Ag/109Ag 107Ag/109Ag RSD = 0.29%
Conclusions • Fast simultaneous detection provides better element and isotope ratios. • Precision of signal ratios are primarily controlled by counting statistics if practical (<2000 sec) integration time is used. • The improved performance helps applications: • isotope ratio analysis from small or heterogeneous samples, using steady state or transient signals • isotope dilution analysis • internal standardization even for fast changing transient signals: speciation, chromatography, laser ablation