Download
1 / 24

E N D
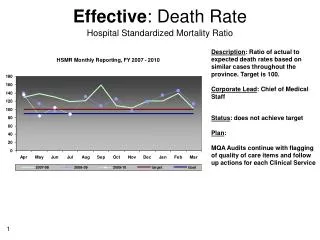
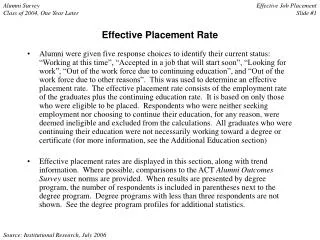
Alumni Survey Class of 2004, One Year Later Effective Placement Rate • Alumni were given five response choices to identify their current status: “Working at this time”, “Accepted in a job that will start soon”, “Looking for work”, “Out of the work force due to continuing education”, and “Out of the work force due to other reasons”. This was used to determine an effective placement rate. The effective placement rate consists of the employment rate of the graduates plus the continuing education rate. It is based on only those who were eligible to be placed. Respondents who were neither seeking employment nor choosing to continue their education, for any reason, were deemed ineligible and excluded from the calculations. All graduates who were continuing their education were not necessarily working toward a degree or certificate (for more information, see the Additional Education section) • Effective placement rates are displayed in this section, along with trend information. Where possible, comparisons to the ACT Alumni Outcomes Survey user norms are provided. When results are presented by degree program, the number of respondents is included in parentheses next to the degree program. Degree programs with less than three respondents are not shown. See the degree program profiles for additional statistics.
Alumni Survey Class of 2004, One Year Later Figure 5Which one category BEST describes your current employment status?By Campus Note: *This category is excluded when calculating effective placement status/rate. Includes all degree levels.
Alumni Survey Class of 2004, One Year Later Effective Placement StatusBy Graduation Year: All Campuses Note: Effective placement rate = % who were either employed or continuing their education, of those eligible to be placed (i.e. excludes those not in the work force). Includes all degree levels.
Alumni Survey Class of 2004, One Year Later Effective Placement RateBy Graduation Year and Campus Note: Effective placement rate = % who were either employed or continuing their education, of those eligible to be placed (i.e. excludes those not in the work force). Includes all degree levels.
Alumni Survey Class of 2004, One Year Later Effective Placement StatusERAU (DB/PC) vs. User Norm (ACT) Effective Placement Rate = 95% Effective Placement Rate = 97% Note: Effective placement rate = % who were either employed or continuing their education, of those eligible to be placed (i.e. excludes those not in the work force). Includes all degree levels. ERAU data is for residential campuses only.
Alumni Survey Class of 2004, One Year Later Effective Placement RateBy Degree Level and Graduation Year: All Campuses Note: Effective placement rate = % who were either employed or continuing their education, of those eligible to be placed (i.e. excludes those not in the work force).
Alumni Survey Class of 2004, One Year Later Effective Placement StatusBy Degree Level: ERAU (DB/PC) vs.User Norm (ACT) Effective Placement Rate = 94% Effective Placement Rate = 98% Note: Effective placement rate = % who were either employed or continuing their education, of those eligible to be placed (i.e. excludes those not in the work force). ERAU data is for residential campuses only.
Alumni Survey Class of 2004, One Year Later Effective Placement RateBy Gender and Graduation Year: All Campuses Note: Effective placement rate = % who were either employed or continuing their education, of those eligible to be placed (i.e. excludes those not in the work force). Includes all degree levels.
Alumni Survey Class of 2004, One Year Later Effective Placement StatusBy Gender: User Norm (ACT) Effective Placement Rate = 95% Effective Placement Rate = 94% Effective Placement Rate = 98% Effective Placement Rate = 98% Note: Effective placement rate = % who were either employed or continuing their education, of those eligible to be placed (i.e. excludes those not in the work force). ERAU data is for residential campuses only.
Alumni Survey Class of 2004, One Year Later Effective Placement StatusBy Graduation Year: Daytona Beach Note: Effective placement rate = % who were either employed or continuing their education, of those eligible to be placed (i.e. excludes those not in the work force). Includes all degree levels.
Alumni Survey Class of 2004, One Year Later Effective Placement RateBy Degree Level and Graduation Year: Daytona Beach Note: Effective placement rate = % who were either employed or continuing their education, of those eligible to be placed (i.e. excludes those not in the work force). Total includes all degree levels.
Alumni Survey Class of 2004, One Year Later Effective Placement StatusBy College and Degree Program: Daytona Beach Note: Effective placement status = those eligible to be placed (I.e. excludes those not in the work force due to other reasons).
Alumni Survey Class of 2004, One Year Later Effective Placement RateBy College and Degree Program: Daytona Beach Note: Effective placement rate = % who were either employed or continuing their education, of those eligible to be placed (i.e. excludes those not in the work force).
Alumni Survey Class of 2004, One Year Later Effective Placement RateBy Gender and Graduation Year: Daytona Beach Note: Effective placement rate = % who were either employed or continuing their education, of those eligible to be placed (i.e. excludes those not in the work force). Includes all degree levels.
Alumni Survey Class of 2004, One Year Later Effective Placement StatusBy Graduation Year: Prescott Note: Effective placement rate = % who were either employed or continuing their education, of those eligible to be placed (i.e. excludes those not in the work force). Includes all degree levels.
Alumni Survey Class of 2004, One Year Later Effective Placement RateBy Degree Level and Graduation Year: Prescott Note: Effective placement rate = % who were either employed or continuing their education, of those eligible to be placed (i.e. excludes those not in the work force).
Alumni Survey Class of 2004, One Year Later Effective Placement StatusBy College and Degree Program: Prescott Note: Effective placement status = those eligible to be placed (I.e. excludes those not in the work force due to other reasons).
Alumni Survey Class of 2004, One Year Later Effective Placement RateBy College and Degree Program: Prescott Note: Effective placement rate = % who were either employed or continuing their education, of those eligible to be placed (i.e. excludes those not in the work force).
Alumni Survey Class of 2004, One Year Later Effective Placement RateBy Gender and Graduation Year: Prescott Note: Effective placement rate = % who were either employed or continuing their education, of those eligible to be placed (i.e. excludes those not in the work force). Includes all degree levels.
Alumni Survey Class of 2004, One Year Later Effective Placement StatusBy Graduation Year: Extended Campus Note: Effective placement rate = % who were either employed or continuing their education, of those eligible to be placed (i.e. excludes those not in the work force). Includes all degree levels.
Alumni Survey Class of 2004, One Year Later Effective Placement RateBy Degree Level and Graduation Year: Extended Campus Note: Effective placement rate = % who were either employed or continuing their education, of those eligible to be placed (i.e. excludes those not in the work force).
Alumni Survey Class of 2004, One Year Later Effective Placement StatusBy Department and Degree Program: Extended Campus Note: Effective placement status = those eligible to be placed (I.e. excludes those not in the work force due to other reasons).
Alumni Survey Class of 2004, One Year Later Effective Placement RateBy Department and Degree Program: Extended Campus Note: Effective placement rate = % who were either employed or continuing their education, of those eligible to be placed (i.e. excludes those not in the work force).
Alumni Survey Class of 2004, One Year Later Effective Placement RateBy Gender and Graduation Year: Extended Campus Note: Effective placement rate = % who were either employed or continuing their education, of those eligible to be placed (i.e. excludes those not in the work force). Includes all degree levels.