Download
1 / 28
280 likes | 472 Views
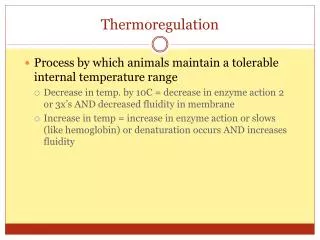
What Factors Limit Species' Ranges?. Biotic = species interactions (e.g., competition, predation)Abiotic = habitat features, including climateTemperature has been called one of the master limiting factors to the distribution of life on earth" (Krebs 1985)Scale of Operation: Biotic factors genera

E N D
1. Thermoregulation and Biogeography Root, T. 1988. Energy constraints on avian distributions and abundances. Ecology 69:330-339.
Repasky, R.R. 1991. Temperature and the northern distributions of wintering birds. Ecology 72:2274-2285.
Canterbury, G. 2002. Metabolic adaptation and climatic constraints on winter bird distributions. Ecology 83:946-957.
2. What Factors Limit Species� Ranges? Biotic = species interactions (e.g., competition, predation)
Abiotic = habitat features, including climate
Temperature has been called one of the �master limiting factors to the distribution of life on earth� (Krebs 1985)
Scale of Operation: Biotic factors generally at local scale, abiotic factors at larger scales
3. Physiological Capacities & Distribution Root (1988): Relatively few studies have related physiological capacities to species distributions
Still generally true, although climate change research has stimulated recent study
Why?
Scale Effects = ecological studies generally focus on local scale and local factors (often biotic) obscure large-scale abiotic effects
Prior knowledge about which species are affected by climate needed
4. Root, T. 1988. Ecology 69:330-339 Stimulated work on climate, metabolic rates, and bird distributions
Root claims that 62 species of birds wintering in North America have their northern range boundary (NRB) �strongly� associated with the average minimum January temperature isotherm.
6. Methods Distribution data from National Audubon Society�s Christmas Bird Counts (CBCs) from 1962-1971
Determined association of NRB with isotherms by measuring area between NRB and nearest isotherm then dividing by length of isotherm.
If avg deviation < 115 km then assume association
Caution: 115 km can show fairly substantial temperature differences in some areas
8. Methods Study focuses on 51 species of passerine birds with NRB associated with minimum January temperature isotherms
Used literature values for BMR and for metabolic response to temperatures for 14 species to calculate MR at NRB (= NBMR)
Caution: MR shows phenotypic flexibility; MR not measured on populations at isotherms
Caution: Also assumes that slope (C) is constant below Tcrit which is not true in many cases
11. Results NBMR for the 14 species with metabolic measurements averaged 2.45 X BMR
NBMR and BMR calculated allometrically from Mb for 37 additional passerines, average NBMR = 2.64 X BMR
MR at limit of high abundance (AEMR) for 7 species = 2.13 X BMR
14. Conclusions Large-scale biogeographic patterns for many species directly linked with physiological demands
Range limits determined (at least in part) by energy expenditures necessary to thermoregulate in cold climates
15. Criticisms of Root (1988) Scalar multiples of BMR a statistical artifact? (Castro 1989. Ecology 70: 1181-1182)
Northern range boundaries not as closely associated with isotherms as Root implies
Reanalyses: scalar multiples of BMR do not cluster at clear upper limit at NRB
Repasky, R.R. 1991. Ecology 72:2274-2285.
Canterbury, G. 2002. Ecology 83:946-957.
16. Canterbury 2002. Ecology 83:946-957. Reviews Repasky (1991) results, which contrast with Root (1988):
Many spp w/ substantial variation in Ta along NRB
Little association of physiologically predicted temperature limits and coldest part of range
17. Canterbury 2002. Ecology 83:946-957. Predictions:
If all species limited by a uniform physiological constraint on MMR, then MR at NRB should cluster tightly around constant multiple of BMR
If physiol constraint on MMR is variable, MR at NRB will also vary among species
MMR treated as a scalar mulitple of BMR � is this valid?
Does metabolic expansibility also vary among species?
18. Methods Used metabolic data from literature to calculate NBMR for 28 passerines
NBMR = BMR + (Tlc � TRB) � C
Physiological Estimation of Limiting Temp (hypothetical MR constraint of 2.9 X BMR)
PTL = Tlc � 1.90 (BMR/C)
Allometric Estimation of Limiting Temp (ATL, from scaling equations for BMR, C and Tlc, with a hypothetical MR constraint of 2.9 X BMR)
ATL = 40.3 � 33.15 (Mass)0.19
19. Methods CBC data used for determining distributions
Estimated avg. coldest temp encountered by each species as the range boundary temperature; TRB = mean min Jan temp at coldest CBC site in range
Compared diet category and migratory status variables
Employed both standard and PIC analyses
20. Results Differences between physiologically and allometrically calculated temperature limits significantly correlated with Tlc, but not with BMR or C ? cold acclimatization involves ?Tlc
21. Results No obvious ceiling for NBMR/BMR (no clustering around 2.5 X BMR as in Root 1988)
NBMR/BMR lower in insectivores (2.20) than in non-insectivores (2.53), but difference disappears in PIC analyses ? diet may influence range boundaries
NBMR not significantly correlated with BMR (high BMR doesn�t produce high NBMR)
Physiological estimation of TRB better than allometric estimation
24. Conclusions Significant correlation between physiological-predicted TRB and observed TRB consistent with hypothesis that physiological temperature tolerance limits range boundaries
No obvious ceiling on NBMR/BMR. Contrasts with results of Root (1988); Highest values for NBMR/BMR = 2.8-3.1
Lack of ceiling suggests that temperature limit may not be direct limit (or that NBMR/BMR is not the right metric?)
25. Conclusions Alternative explanation for correlation betw. physiological temp limit and TRB may be acclimatization of northern species to colder temperatures (cause-effect problem)
Interspecific variation in metabolic ceilings ? error in estimating physiological temp limit (based on constant metabolic ceiling) ? underestimation of effect of metabolic constraints on range boundaries
26. Suggestions for Future Research Multiple species studies of MR and temperature tolerance in non-food limited individuals to test whether food availability or metabolic constraints limit ranges
Common-garden studies to reduce effects of phenotypic flexibility and test genetic diffs
Future studies should focus on maximum MRs in the cold
27. Thermogenic Capacity and Distribution Question: Are scalar multiples of BMR the most pertinent measure to address the influence of thermoregulation on range limits?
Thermogenic Capacity (or summit metabolism, Msum) sets upper limit for heat production in endotherms
Msum importance to metabolic ceilings and climate in birds:
Limits thermogenic performance
Positive correlation with thermogenic endurance
28. Thermogenic Capacity and Distribution Metabolic expansibility (ME) = Msum/BMR; signifies capacity for elevating MR in cold
Msum in birds exceeds BMR by 3 to 9-fold
Variability in ME implies that a given elevation of metabolic rate for thermogenesis above BMR would result in MRs that represent markedly different fractions of Msum.
Example:
MR of 2.5 X BMR = 83% of Msum for a bird with ME of 3
Only 31% of Msum for a bird with ME of 8
29. Thermogenic Capacity and Distribution Fraction of maximum MRs (usually measured by locomotion) sustained for prolonged periods = 60 to 85% in birds and mammals
Fractions of maximum MRs that can be sustained apparently less variable than ME
Metabolic ceilings in relation to climate might be determined by the fraction of Msum that can be sustained
Fraction of MMR (or Msum) that can be sustained might be a better measure of metabolic ceilings than multiples of BMR