Download
1 / 31
310 likes | 444 Views
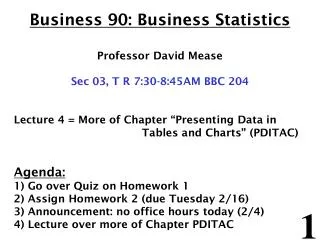
Business 90: Business Statistics Professor David Mease Sec 0 3 , T R 7 : 3 0- 8 : 4 5AM BBC 204 Lecture 4 = More of Chapter “Presenting Data in Tables and Charts” (PDITAC) Agenda: 1) Go over Quiz on Homework 1 2) Assign Homework 2 (due Tuesday 2/16)

E N D
Business 90: Business Statistics Professor David Mease Sec 03, T R7:30-8:45AM BBC 204 Lecture 4 = More of Chapter “Presenting Data in Tables and Charts” (PDITAC) Agenda: 1) Go over Quiz on Homework 1 2) Assign Homework 2 (due Tuesday 2/16) 3) Announcement: no office hours today (2/4) 4) Lecture over more of Chapter PDITAC
Homework 2 - Due Tuesday 2/16 1) Read the chapter entitled “Presenting Data in Tables and Charts” 2) The Excel file at http://www.cob.sjsu.edu/mease_d/old-quiz-scores.xls has Quiz 1 scores for a Bus 90 class I thought last semester. Right click this link and select "Save Target As..." to download this file onto your computer. Then open it using Excel. a) Make the frequency distribution by hand. Begin at 0 and end at 22 using 11 intervals. (Hint: You may use Excel to sort the data first if you like). b) Graph the frequency histogram by hand. c) Graph the percentage polygon by hand. d) Make the cumulative percentage distribution by hand. e) Graph the ogive by hand. f) Check your answer for part a using Excel. 3) The data at http://www.cob.sjsu.edu/mease_d/houses.xls has house prices for a sample of 1500 California homes. The prices are in thousands of dollars. Right click this link and select "Save Target As..." to download this file onto your computer. Then open it with Excel and use Excel to do the following. **Be sure to print out your solutions and bring them with you to class for the quiz.** a) Make the frequency distribution using Excel. Begin at 0 and end at 3.5 million using 7 intervals. b) Graph the percentage histogram using Excel. c) Graph the percentage polygon using Excel. d) Make the cumulative percentage distribution using Excel. e) Graph the ogive using Excel.
Announcement: Today (2/4) I will not have office hours. If you need to talk to me please email me or call (419-944-9652).
Statistics for Managers Using Microsoft® Excel4th Edition Presenting Data in Tables and Charts
Chapter Goals After completing this chapter, you should be able to: • Create an ordered array • Construct and interpret a frequency distribution, histogram, and polygon for numerical data • Construct and interpret a cumulative percentage distribution and ogive for numerical data • Create and interpret contingency tables, bar charts, and pie charts for categorical data • Create and interpret a scatter diagram and a least squares regression line (in other chapter p. 387-398) • Describe appropriate and inappropriate ways to display data graphically
Example: Below are Bus 90 midterm exam scores. Describe this data. 92 60 83 36 62 65 80 88 50 63 92 64 84 89 83 80 88 91 90 84 71 77 25 92 49 88 54 51 59 41 71 53 69 68 68 57 60 90 66 50
In class exercise #5: Construct a frequency distribution for the exam scores beginning at 20 and ending at 100 using 8 intervals.
Graphing Numerical Data: The Histogram • A graph of the data in a frequency distribution is called a histogram • The class boundaries (or class midpoints) are shown on the horizontal axis • the vertical axis is either frequency or percentage • Bars of the appropriate heights are used to represent the number of observations within each class
In class exercise #6: Construct a frequency histogram for the exam scores.
In class exercise #7: Could I use frequency histograms to compare exam scores for two different classes?
In class exercise #8: Construct a percentage distribution for the exam scores.
In class exercise #9: Construct a percentage histogram for the exam scores.
Frequency Distributions in Excel In ICE #5 we constructed a frequency distribution for the exam scores. 92 60 83 36 62 65 80 88 50 63 92 64 84 89 83 80 88 91 90 84 71 77 25 92 49 88 54 51 59 41 71 53 69 68 68 57 60 90 66 50 Next we will learn how to make frequency distributions using Microsoft Excel. This is especially useful for large data sets.
Frequency Distributions in Excel 1) First make a column with your desired upper end points for your intervals. 2) Next highlight a column (of the same length) to store the frequency values. 3) Do insert > function > statistical > frequency. 4) “Data_array” is the data and “Bins_array” is your desired upper end points for your intervals. 5) IMPORTANT: You must hold down shift and control keys then press enter.
In class exercise #10: Construct a frequency distribution for the exam scores using Excel.
Frequency Distributions in Excel Problem: We do “up to but not including” but excel doesn’t do this. Solution: Change 30 to 29.99 and change 40 to 39.99 and so on. But you don’t want it to say 29.99 when you make your table. Solution: Paste table somewhere else and then fix the numbers.
In class exercise #10: Construct a frequency distribution for the exam scores using Excel. ANSWER:
In class exercise #11: Construct a percentage distribution for the exam scores using Excel.
In class exercise #11: Construct a percentage distribution for the exam scores using Excel. ANSWER:
Histograms in Excel 1) You first need one column with the class MIDPOINTS and another column that has the frequencies. 2) Do insert > chart > column.
Histograms in Excel 3) Click “Next” and put your frequencies in the “Data range” and then click the “series” tab at the top and put your midpoints in the “Category (X) axis labels” 4) Add axis labels and a title, remove the legend and then click “Finish”
Histograms in Excel 5) IMPORTANT: Histograms do not have gaps. Correct this by double clicking on any bar, go to “Options” and make the “Gap width” be 0.
In class exercise #12: Construct a frequency histogram for the exam scores using Excel.
In class exercise #12: Construct a frequency histogram for the exam scores using Excel. ANSWER:
In class exercise #13: Construct a percentage histogram for the exam scores using Excel.
In class exercise #13: Construct a percentage histogram for the exam scores using Excel. ANSWER:
Questions for Grouping Data into Classes • 1. How wide should each interval be? (How many classes should be used?) • 2. How should the endpoints of the intervals be determined? • Often answered by trial and error, subject to user judgment • The goal is to create a distribution that is neither too "jagged" nor too "blocky” • Goal is to appropriately show the pattern of variation in the data
How Many Class Intervals? • Too Many (Narrow class intervals) • may yield a very jagged distribution with gaps from empty classes • Can give a poor indication of how frequency varies across classes • Too Few (Wide class intervals) • may compress variation too much and yield a blocky distribution • can obscure important patterns of variation.