Download
1 / 16
160 likes | 187 Views
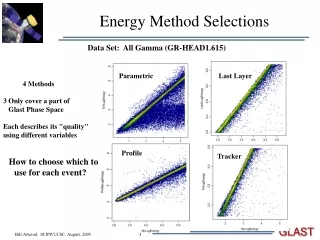
Energy Method Selections. Data Set: All Gamma (GR-HEAD1.615). Parametric. Last Layer. 4 Methods 3 Only cover a part of Glast Phase Space Each describes its "quality" using different variables How to choose which to use for each event?. Profile. Tracker.

E N D
Energy Method Selections Data Set: All Gamma (GR-HEAD1.615) Parametric Last Layer 4 Methods 3 Only cover a part of Glast Phase Space Each describes its "quality" using different variables How to choose which to use for each event? Profile Tracker
Begin comparison by determining the Correction method that results in the energy closest to the MC Truth Results summarized in the following table: Only Parametric Available: 37.7% This tends to be the Local Land Fill (City Dump!) Unfortunately there are too many events here to simply throw out.
Intercomparison Method: For each event determine the Energy Correction Method that gives an energy closest to the MC Truth. Break into classes according to which Energy Corr. methods were calculated: 1) Param - Parametric only 2) Profile - Profile & Parametric 3) Tracker – Tracker & Parametric 4) Last Layer – Last Layer & Parametric 5) ProfLL – Profile, Last Layer & Param. 6) LLTracker – Last Layer, Tracker & Param. Not all Methods report an energy for all events Perform a CT based selection independently for each catagory: 5 CTs Combine CTs to compute a BestEnergy for the event. MC Truth CT Prediction Then build 3 more CTs Clipped the tails....
"Best" Probability Distribution Intercomparison & Best Energy Determination Break Down by Energy & Prob Resolutions for Different Prob. Cuts 1.8-18 GeV 18-180 MeV 180-1800 MeV 18-180 GeV [.75 – 1.00] [.50 - .75] [.25 - .50] Prob: [0 - .25]
Intercomparison Method Conclusions 1) The best energy resolution is achieved by combining all the results 2) The Last Layer / Tracker methods have the smallest overshoot problems - Cover the smallest phase-space - Based on observed correlations 3) Profile Fit demonstrates that a detailed fit to the 3D energy depositions works and accomplishes in a single approach both inter tower gaps and leakage corrections. 4) Parametric method provides a floor from which to improve. - Assumes a factorized model of inter tower gaps and leakage correction. 5) Intercomparison Method suffers from: - Irregularity of which methods are available event-to-event - Each Method has its own self description indicating how well it did (e.g. Profile has a c2, Last Layer has a relative energy error, etc.) - The above leads to ambiguities and complexity ... total of 8 CT's!
Alternative: Direct Comparison Against an External Resolution Model Second Method: Compare each Energy Correction Method against a common External model. Select Method with the highest probability in each event for both the energy & final probability of being "Good" Resolution Model: Parametric Rep. of Data Common Variables
The Resulting 4 CTs Indicates Added Variables Profile CT Added Variables: CalCfpChiSq CalCfpEffRLn Last Layer CT Added Variables: CalLllEneErr
Tracker CT Added Variables: CalTklEneErr Parametric CT Added Variables: CalLeakCorr CalEdgeCorr CalTotalCorr CalCsIRLn CalGapFraction CalDeadTotRat CalDeltaT
E3: Balanced CTs - 2s on s=.05+.72/(log(E))3 "Best" Probability Distribution Resolutions for Different Prob. Cuts Break Down by Energy & Prob 1.8-18 GeV 18-180 MeV 180-1800 MeV 18-180 GeV [.75 – 1.00] [.50 - .75] [.25 - .50] Prob: [0 - .25]
E4: Unbalanced CTs - 2s on s=.05+.72/(log(E))3
E5: Unbalanced CTs – 1.5s on s=.05+.72/(log(E))3
E4: Unbalanced CTs - 2s on s=.05+.72/(log(E))3 Parametric Only Best (Combined) Parametric Only Best (Combined) Hi E Tail greatly attenuated with No Cuts!
Prob. > .10 Eff. = .903 Prob. > .20 Eff. = .826
Prob. > .40 Eff. = .703 Conclusions The Direct Comparison Method Offers - Simplicity - Avoids the Ambiguities of the Intercomparison Method - Results in a smooth loss in efficiency as the Prob. Cut in increased - Overall – seems to be the Method of Choice (for now!)
E4: Unbalanced CTs - 2s on s=.05+.72/(log(E))3 Data Set: AG1617-mod
And..... cos(q) < -.9 Layers 10-13 Layers 14-17 Layers 6-9 Layers 2-5 Previously Observed Fall-off at Hi Energy is GONE!!!! Conclusion: AG1617-mod results very similar to those gotten with AG1615