Download
1 / 16
160 likes | 175 Views
An overview of transmission transfer studies and results for Lower Michigan from the T/D Group status update by Thomas Vitez. Factors influencing transfer capacity include Topology, Capacity, and Response. Learn about determination of transfer capability through simplified examples and more.

E N D
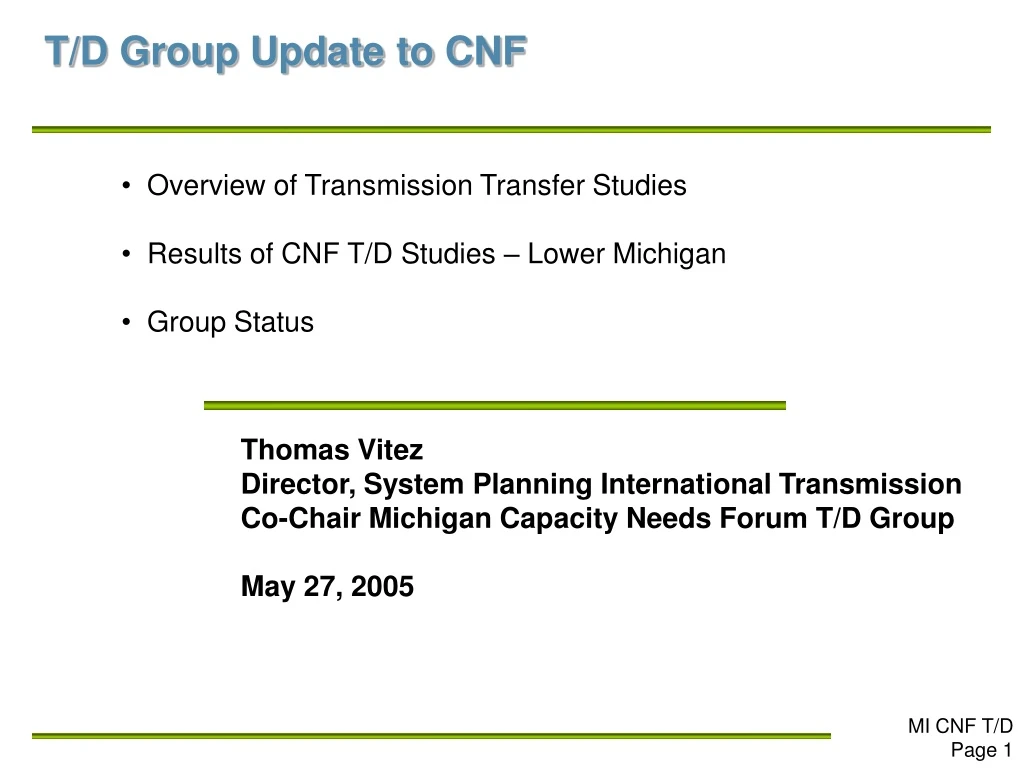
T/D Group Update to CNF • Overview of Transmission Transfer Studies • Results of CNF T/D Studies – Lower Michigan • Group Status Thomas VitezDirector, System Planning International TransmissionCo-Chair Michigan Capacity Needs Forum T/D GroupMay 27, 2005
Factors that Influence How Much Can be Transferred Across the Transmission System • “Topology” – how many facilities are there and how are they connected? • “Capacity” – what are these facilities capable of carrying? • “Normal” – amount of flow that can be carried for an indefinite period of time • “Emergency” – amount of flow that can be carried for a shorter, defined period of time • “Response” – how does the transfer split up amongst the facilities (related to topology) • “Normal” – all facilities in service • “Post-Contingency” – after facility is outaged • “Pre-load” – how much is flow on the lines before transfers? • “Base” – starting generator dispatch • “Alternative Dispatch” 200 /400 100% 40% 0% X 0 100 Area B Area A 60% 0% X 100% /320 300 G X 0 100
Determination of Transfer Capability – Simplified Example 200 40% Line 1 0 Area B Area A Line 2 G • For A to B transfers – Line 1 with G in-service and all transmission in-service • 200 MWs rating + 0 MWs pre-existing flow = 200 MWs of capacity available • A to B transfers * 40% = 200 • A to B transfers limited to 500 MWs for this condition Check -- Flow through Line 1 After Transfer pre-existing flow + percentage of transfer * transfer = Rating of Line 1 0 + 40% * 500 = 200 • A to B transfers limit confirmed for this condition
Determination of Transfer Capability – Simplified Example Continued Line 1 Area B Area A X 300 60% Line 2 G 100 • For A to B transfers – Line 2 with G out and all transmission in-service • 300 MWs rating - 100 MWs pre-existing flow = 200 MWs of capacity available • A to B transfers * 60% = 200 • A to B transfers limited to 333 MWs for this condition Check -- Flow through Line 2 After Transfer pre-existing flow + percentage of transfer * transfer = Rating of Line 2 100 + 60% * 333 = 300 • A to B transfers limit confirmed for this condition
Determination of Transfer Capability – Simplified Example Continued Some More Line 1 X Area B Area A 320 100% Line 2 G 0 • For A to B transfers – Line 2 with Line 1 out • 320 MWs rating - 0 MWs pre-existing flow = 320 MWs of capacity available • A to B transfers * 100% = 320 • A to B transfers limited to 320 MWs for this condition Check -- Flow through Line 2 with Line 1 out After Transfer pre-existing flow + percentage of transfer * transfer = = Rating of Line 2 0 + 100% * 320 = 320 • A to B transfers limit confirmed for this condition
Determination of Transfer Capability – Simplified Example -- Wrap Up • What is the transfer capability? • Line 1 with G in and all transmission in-service – 500 MWs • Line 2 with G in and all transmission in-service – 333 MWs • Line 2 with Line 1 out – 320 MWs • Transfer Limit = Overall Minimum = 320 MWs 200 /400 Line 1 Area B Area A /320 300 Line 2 G
Determination of Transfer Capability – Not So Simple Illustration 2 3 Area A Area B With sub-areas 1 2 Area D Area C Area E • Any facility can limit transfers – including lines between sub-areas • Dispatch and load patterns throughout the area impact results – this includes “parallel” transfers
T/D Group Results Lower Michigan – Analysis Performed • All transmission in-service + • “Base” Generation Dispatch – OR -- • One Unit in MECS out • One transmission element out + • “Base” Generation Dispatch – OR -- • One Unit in MECS out • Sensitivities • Flow changes on Michigan-Ontario Interface • Unit outages outside MECS • Areas monitored – ITC, METC, AEP, NIPSCo, FE • Assumptions include – Sufficient Generation Outside of MECS to “fill the pipe”
Transmission/Distribution Work Group Status • Transmission/Distribution Work Group Status • Transfer Capability Results Published for Lower Michigan • Transmission Upgrades Scenarios for Lower Michigan Identified and Analyzed • Remaining Work • Complete Review of Potential Voltage Limits • Publish Results for Upper Michigan • Analyze Off-Peak Conditions • Issue Report • Continue Work with Other CNF Groups Questions?