Networks and Algorithms in Bio-informatics
360 likes | 534 Views
Networks and Algorithms in Bio-informatics. D. Frank Hsu Fordham University hsu@cis.fordham.edu *Joint work with Stuart Brown; NYU Medical School Hong Fang Liu; Columbia School of Medicine and Students at Fordham, Columbia, and NYU. Outlines. (1) Networks in Bioinformatics

Networks and Algorithms in Bio-informatics
E N D
Presentation Transcript
Networks and Algorithms in Bio-informatics D. Frank HsuFordham Universityhsu@cis.fordham.edu *Joint work with Stuart Brown; NYU Medical School Hong Fang Liu; Columbia School of Medicineand Students at Fordham, Columbia, and NYU
Outlines (1) Networks in Bioinformatics (2) Micro-array Technology (3) Data Analysis and Data Mining (4) Rank Correlation and Data Fusion (5) Remarks and Further Research
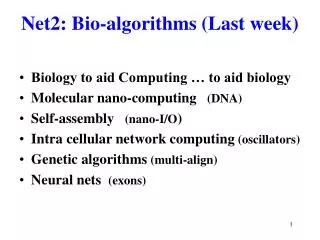
(1) Networks in Bioinformatics • Real NetworksGene regulatory networks, Metabolic networks, Protein-interaction networks. • Virtual NetworksNetwork of interacting organisms, Relationship networks. • Abstract NetworksCayley networks, etc.
(1) Networks in Bioinformatics, (A)&(B) DNA RNA Protein Biosphere - Network of interacting organisms Organism - Network of interacting cells Cell - Network of interacting Molecules Molecule - Genome, transcriptome, Proteome
The DBRF Method for Inferring a Gene Network S. Onami, K. Kyoda, M. Morohashi, H. Kitano In “Foundations of Systems Biology,” 2002 Presented by Wesley Chuang
Inference Rule of Genetic Interaction • Gene a activates (represses) gene b if the expression of b goes down (up) when a is deleted.
Parsimonious Network • The route consists of the largest number of genes is the parsimonious route; others are redundant. • The regulatory effect only depends on the parity of the number negative regulations involved in the route.
A Gene Regulatory Network Model node: gene edge: regulation va: expression level of gene a Ra: max rate of synthesis g(u): a sigmoidal function W: connection weight ha: effect of general transcription factor λa: degradation (proteolysis) rate Parameters were randomly determined.
Experiment Results • Sensitivity: the percentage of edges in the target network that are also present in the inferred network. • Specificity: the percentage of edges in the inferred network that are also present in the target network N: gene number K: max indegree
Conclusion • Applicable to continuous values of expressions. • Scalable for large-scale gene expression data. • DBRF is a powerful tool for genome-wide gene network analysis.
(3) Data Analysis and Data Mining • cDNA microarray & high-clesity oligonucleotide chips • Gene expression levels, • Classification of tumors, disease and disorder (already known or yet to be discovered) • Drug design and discovery, treatment of cancer, etc.
(3) Data Analysis and Data Mining Tumor classification - three methods (a) identification of new/unknown tumor classes using gene expression profiles. (Cluster analysis/unsupervised learning) (b) classification of malignancies into known classes. (discriminant analysis/supervised learning) (c) the identification of “marker” genes that characterize the different tumor classes (variable selection).
(3) Data Analysis and Data Mining Cancer classification and identification • HC – hierarchical clustering methods, • SOM – self-organizing map, • SVM – support vector machines.
(3) Data Analysis and Data Mining Prediction methods (Discrimination methods) • FLDA – Fisher’s linear discrimination analysis • ML – Maximum likelihood discriminat rule, • NN – nearest neighbor, • Classification trees, • Aggregating classifiers.
Rank Correlation and Data Fusion • Problem 1: For what A and B, P(C)(or P(D))>max{P(A),P(B)}? • Problem 2: For what A and B, P(C)>P(D)?
Theorem 3:Let A, B, C and D be defined as before. Let sA=L and sB=L1L2 (L1 and L2 meet at (x*, y*) be defined as above). Let rA=eA be the identity permutation. If rB=t。eA, where t= the transposition (i,j), (i<j), and q<x*, then P@q(C) P@q(D).
References • Lenwood S. Heath; Networks in Bioinformatics, I-SPAN’02, May 2002, IEEE Press, (2002), 141-150 • Minoru Kanehisa; Prediction of higher order functional networks from genomie data, Bharnacogonomics (2)(4), (2001), 373-385. • D. F. Hsu, J. Shapiro and I. Taksa; Methods of data fusion in information retrieval; rank vs. score combination, DIMACS Technical Report 2002-58, (2002) • M. Grammatikakis, D. F. Hsu, and M. Kratzel; Parallel system interconnection and communications, CRC Press(2001). • S. Dudoit, J. Fridlyand and T. Speed; Comparison of discrimination methods for the classification of tumors using gene expressions data, UC Berkeley, Technical Report #576, (2000).