Download
1 / 8
90 likes | 186 Views
Analyzing heat transfer coefficients and conductivity values to assess effectiveness of water bath cooling system. Calculations and results presented for electrode heat generation and coolant temperature change time. Essential data to optimize system with LabVIEW.

E N D
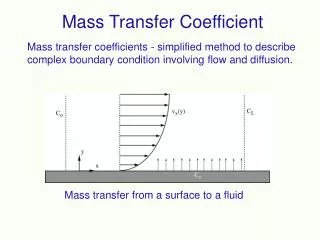
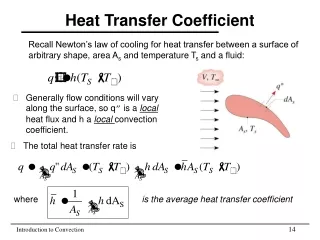
Utilizing the elemental propertie values, the Overall Heat Transfer Coefficient. [Reference] Forced Convection of water http://www.engineeringtoolbox.com/convective-heat-transfer-d_430.html Thermal Conductivity http://www.engineeringtoolbox.com/thermal-conductivity-liquids-d_1260.html
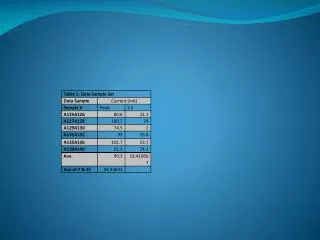
Table 5 illustrates the Heat Generated from the electrodes • Applied an average of peak and steady state current use • Ultimately calculate the • temperature difference from Solution to coolant, to see how effective the water bath system is at cooling.
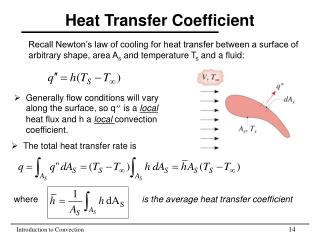
Initial Temperature of solution was 65 Deg C • Temperature was calculated with the Heat Transfer Equation (Previous Slide) • Table 6 • Heat Generated from the electrodes • average peak current; • calculated the T of the coolant • Table 7 • Heat Generated from the electrodes • Average steady state current • Calculated the T of the coolant
Table 8 illustrates the time required for the chiller to change the coolant temperature by 1 degree. • Table 9 illustrates the time required for the chiller to translate from the peak heat generated to the steady state heat generated. • These results provide vital information on what needs to be done with labview.