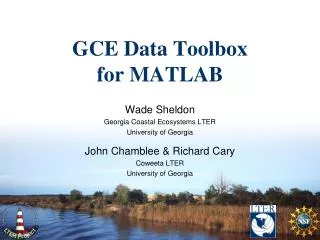
GCE Data Toolbox for MATLAB
GCE Data Toolbox for MATLAB. Wade Sheldon Georgia Coastal Ecosystems LTER University of Georgia John Chamblee & Richard Cary Coweeta LTER University of Georgia. Background & Motivation. Georgia Coastal Ecosystems LTER project started in Sept 2000 Large and varied data collection effort

GCE Data Toolbox for MATLAB
E N D
Presentation Transcript
GCE Data Toolboxfor MATLAB Wade Sheldon Georgia Coastal Ecosystems LTER University of Georgia John Chamblee & Richard Cary Coweeta LTER University of Georgia
Background & Motivation • Georgia Coastal Ecosystems LTER project started in Sept 2000 • Large and varied data collection effort • NSF & LTER require data and metadata archiving, sharing • Needed to standardize data processing, quality control, documentation • No ready-to-use software for LTER data management • Lots of great papers and reports, no tools to download • Most LTER sites were using “flat files” – limiting • Relational databases emerging – proprietary, complex, require constant network access • Developed custom data management framework using MATLAB • Experienced using MATLAB for automating data processing, GUIs • Better code-reuse potential than database/web solution • Best compromise: file-based but supports fully dynamic operations
What is MATLAB? • From Mathworks: (http://www.mathworks.com/products/matlab/) "MATLAB is a programming environment for algorithm development, data analysis, visualization, and numerical computation. Using MATLAB, you can solve technical computing problems faster than with traditional programming languages, such as C, C++, and Fortran." • Benefits: • Ubiquitous in engineering and many science branches • Rapid development with lots of pre-built functionality, Java integration • Cross-platform code, GUIs and data formats (Windows, *nix, Mac OS/x) • Stable: good support and backward compatibility (~30 year history) • Scalable (netbook to cluster) - great performance with huge data sets • Broad I/O support (serial ports to web services) • Drawbacks: • Commercial ("licensed source") – limits flexibility, costs $-$$$ • Some programming required for maximum use
Toolbox Development • Used ESA’s “FLED” report to guide approach • Gross, Katherine L. and Catherine E. Pake. 1995. Final report of the Ecological Society of America Committee on the Future of Long-term Ecological Data (FLED). Volume I: Text of the Report. The Ecological Society of America, Washington, D.C. • Identified information storage requirements • Any number of numeric and text variables • Attribute metadata for each variable (name, units, description, type, precision, ...) • Structured documentation metadata for dynamic updating, formatting • Versioning and processing history info (lineage) • Quality control rules for every variable, qualifier flags for every value • Designed data model: “GCE Data Structure” • MATLAB “struct” array with named fields for each class of information • Detailed specifications for allowed content in each field • “Virtual table” design based on matched arrays for linking attribute metadata, data, flags • Same philosophy as relational database table plus additional descriptors
Toolbox Development • Developed MATLAB software library to work with data structures • Utility functions to abstract low-level operations (API) • Create structure, add/delete columns, copy/insert/delete rows • Extract, sort, query, update data, update flags • Analytical functions for high-level operations • Statistics, visualizations, geographic & date/time transformations • Unit inter-conversions, aggregation/re-sampling, joining data sets • GUI interface functions to simplify using the toolbox • All functions use metadata, data introspection to auto-parameterize and automate operations (semantic processing) • Developed indexing and search support (and GUI search engine)
Suitability for Real-Time Sensor Data • Good Scalability • Data volumes only limited by computer memory (tested >1 GB data sets) • Multiple instances can be run on high-end, 64bit, clustered workstations • Good flag evaluation performance in use, testing with diverse rule sets • Good scope for automation • Command-line API for unattended batch processing via workflow scripts • Timed and triggered workflow implementations easy to deploy • Support for multiple I/O formats, transport protocols • Formats: ASCII, MATLAB, SQL, specialized (CSI, SBE, NWIS RDB, HADS, …) • Transport: local file system, UNC paths, HTTP, FTP, SOAP • Already used at multiple LTER sites, USGS data harvesting for HydroDB
Implementation Scenarios • End-to-End Processing (logger-to-scientist) • Acquire raw data from logger, file system, network • Assign metadata from template or using forms to validate and flag data • Review data and fine-tune flag assignments • Generate distribution files & plots, archive data, index for searching • Scientists can use toolbox on their desktop to analyze, integrate data • Data Pre-processing • Acquire, validate and flag raw data (on demand or timed/triggered) • Upload processed data files (e.g. csv) or values & flags to RDBMS (e.g HIS) • Workflow Step • Call toolbox from other software as part of workflow (tool-chaining) • Use toolbox as middle-ware between other systems (e.g. Data Turbine & ODM)
Key Concepts • Every operation is performed in context of a "dataset" • Passing data columns to a tool transports metadata as well • Dataset metadata used to guide transformation, plotting, analysis • Metadata used to auto-parameterize functions • Data structure instances are independent • Each step along a workflow results in a complete data set with metadata • Intermediate datasets can be saved or overwritten in workflows • Processing history ("lineage") information captured for all steps • Each tool logs operations by date/time • Data revisions, deletions, flagging captured at user-specified detail • Lineage reported in metadata • Dataset metadata is "live", and updated automatically • Attribute changes • Calculations, unit conversions • Code definitions
Toolbox Timeline • 2001 – Initial toolbox development completed in May 2001 • 2002 – Added basic GUI interface, released code to GCE affiliates • 2003 – Added dynamic data harvesting support (USGS, NOAA, CSI LoggerNet); automated USGS harvesting service for ClimDB/HydroDB • 2004 – Added "search engine" tool for local search/integration of data • 2005 – First public distribution of "compiled" code; source code on request to LTER sites • 2006 – Added ClimDB data mining GUI • 2007 – Added enhanced data synthesis, refactoring tools • 2008 – Added GUI for managing QA/QC rules in metadata templates, additional flag tools • 2009 – Refined XML schema for formatted metadata; code moved to SVN; CWT adopts toolbox • 2010 – Toolbox released as open source (GPLv3); Trac support site established • 2011 – Expanded QA/QC tool options, GUI tools, refinements; focused on usability • 2012 – Added EML support, GUI for batch processing (import/export); ARRA funding received; first training workshop held • 2013 – Added Data Turbine support
What’s Next? • Metadata model enhancements • Add “schema” support for better EML alignment • Add EML unit management • Add EML export to support LTER NIS (PASTA) • Improve harvest management • Add GUI tools for configuring harvest info, plot info • Add GUI for managing timers • Add data harvesting “dashboard” for monitoring activity • Improve documentation and training materials • Time frame: July 2013
Toolbox Code & Support • Web site: https://gce-svn.marsci.uga.edu/trac/GCE_Toolbox • Email List: gcetoolbox-l@listserv.uga.edu(http://www.listserv.uga.edu/) • SVN: https://gce-svn.marsci.uga.edu/svn/GCE_Toolbox/trunk (login required)
Interactive Training • Introduction to the Dataset Editor application • Importing and exploring data • Generic ASCII • Native logger files (Campbell, SeaBird) • Data services (Data Turbine, USGS NWIS) • Metadata management • Defining attribute metadata • Documentation metadata, templates • QA/QC framework • Defining flags and “rules” • Visual QA/QC • Managing flagged data • Creating and exporting products • Batch processing raw data • Integrating data (join, merge) • Summarizing data • Exporting data sets and plots