
“M E ” = 4
Building. [ Simple [ Basic ] economy to Complex economy]. Private - closed. [C + Ig]. Private - open. [C + Ig + Xn ]. …added foreign trade. [C+Ig+ G + Xn ]. Mixed - open. Added gov spending. S. AE 3 (C+Ig +G +Xn) ( Complex Economy ) [ Mixed - open ]. ( AE 3 )630.

“M E ” = 4
E N D
Presentation Transcript
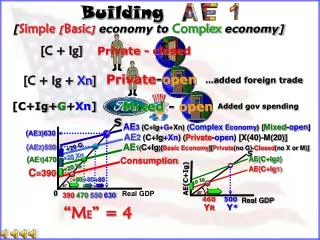
Building [Simple[Basic] economy to Complexeconomy] Private - closed [C + Ig] Private-open [C + Ig + Xn] …added foreign trade [C+Ig+G+Xn] Mixed - open Added gov spending S AE3 (C+Ig+G+Xn) (Complex Economy) [Mixed-open] (AE3)630 AE2 (C+Ig+Xn) (Private-open) [X(40)-M(20)] (AE2)550 AE1(C+Ig)[Basic Economy][Private(noG)-Closed(no X or M)] +20 G S +20 Xn AE(C+Ig2) (AE1)470 Consumption +20 Ig AE(C+Ig1) C=390 AE(C+Ig) +80 +80 +80 10 Ig 0 Real GDP 390470550630 460 500 Real GDP YRY* “ME” = 4
o 45 Building the Model AE[C+Ig] [“Basic” or “Simple” economy] S C + Ig Multiplier=4 $530 510 490 470 450 430 410 390 370 Private - Closed Consumption Equilibrium Ig = $20 Billion AE[C+ Ig](billions ofdollars) C =$450 Billion + 20 Ig +80 o Real GDP 370 390 410 430 450 470 490 510 530 550 GDP will increase by a “multiple” of 4 & that is why it is called the “multiplier”.
Change in QC(or QS) [Income change, movement from point to point] o 45 S SAVING Consumption Breakeven So, the key to a change in QC(QS) is a change in ? Consumption C2 C1 DISSAVING [Negative saving] o DI2 (Disposable Income) DI3 DI1 S SAVING Saving o S DISSAVING Disposable Income
NON-INCOME DETERMINANTS [Shifters]OF CONSUMPTION AND SAVING • Wealth Increase or decrease in wealth • Increase/decrease in PL • Taxationincreases/decreases • Consumer Expectations [about future availability, income, & prices] • Household Debt
Increase in Consumption(Decrease in Saving) [shift/whole curve/non-income] o 45 C2 May be caused by: Increase in wealth Decrease in PL Expect. PL incr. Expect. of positive Y Expect. of shortages Decrease in debt *Decrease in taxes *Decrease in taxes increases both C & S C1 Increases in consumption means… Consumption o Disposable Income I’ll buy more and save even more. Decrease in saving S1 S2 Saving o Disposable Income
o 45 Decrease in Consumption(Increase in Saving) [shift/whole curve/non-income] May be caused by: Decrease in wealth Increase in PL Expect. PL decrease Expect. neg. future Y Increase in debt *Increase in taxes *Increase in taxes decreasesboth C & S C1 C2 Consumption Decreases in consumption means… o Disposable Income Increase in saving S2 S0 Saving o Disposable Income
.986 .976 .972 .940 .907 .873 .869 .842 GLOBAL PERSPECTIVE Average Propensities to Consume [C/Y], Selected Nations, 2000 .80 .85 .90 .95 1.0 Canada United States Netherlands United Kingdom Germany Italy Japan France
2% 8% 6% Real Interest Rate [Nominal I.R.– inflation rate =Real I.R.] - = Real Interest Rate Inflation Premium Nominal Interest Rate - =
Marginal Efficiency of Investment [MEI] [If expected returns equal or exceed the real interest rate of interest, the firm will normally make the investment.] [One firm’s demand curve for investment] 30% 25% 20% 15% 10% 5% MEI = 27% MEI=20% MEI=15% Real Interest Rate MEI=12% MEI = 7% Add new wing to factory $1 mil. Acquire additional power facilities $1.5 mil. Purchase machines $1.5 mil. Renovate plant $2 million Install computer system $1 mil. 0 1 23456 [QID] Quantity of Investment Demanded (millions)
[MEI] 25% 15% 10% Macro Economy’s AD Curve for Ig Firms invest with their profits & alsoborrow(5%) to invest.(10%) 20% [A 20% cost of funds attract $100 billion of investment Real Interest Rates I.R. QID 5% DI (MEI) A 5% cost of funds attracts $200 bil. Ig 150 200 100 0 50 250 QID1 QID2 Change in QID [interest rate change, point to point movements]
Should A New Drill Press Be Purchased? Single Firm • Positive profit expectations and the real interest rate • are the most important determinants of investment. • Drill Press - $1,000 • A.Expected gross profits = $1,100 or a 10%return. • [$100/$1,000 x 100 = 10%] • [At8%,invest; at12%, don’t invest] • B.Real interest rate[nominal interest rate-inflation]
Change in Quantity of Investment Demanded [QID] (Interest rate change, point to point movement) DI 16 14 12 10 8% 6 4% 2 0 Firms will undertake all investments [additions to plant, equipment, inventory, and residential construction]which have an expected rate of net profit greater than [or equal to] the real rate of interest. Expected rate of return, r, and interest rate, i (percents) Monetary Policy– by lowering interest rates, the Fed can increase Ig & employment. • 10 15202530 35 40 • QID Investment (billions) QID [Inverserelationship betweenreal interest rate and QID]
CHANGE [Shift]IN INVESTMENT [curve] • Increase in Investment • Positive profit expectations • Scarcity of inventory • Technology [innovation] • Decrease in production costs • Decrease in business taxes I2 I1 8% QID2 QID1
INVESTMENT DEMAND & SCHEDULE Investment Demand Curve Investment Schedule Ig independent of Y DI Ig 20 Expected rate of return, r, and real interest rate, i (percents) Investment (billions of dollars) 8 20 20 20 20 Y1 Y2 Y3 Investment (billions of dollars) Real Domestic Product, GDP (billions of dollars) In constructing the AE graph, Ig will be independent [not influenced] by income. Investment decisions are made months ahead.
NS 1-6 “Closed” and “private” [C+Ig] “Simple Economy” “Open” & “private” [C+Ig+Xn] “Open” & “mixed” [C+Ig+G+Xn] “Complex Economy” C+Ig Assumptions:No internat. trade or “G” ; no business saving; depreciation & NFFIEUS are 0; PL is constant [Keynesian] [GDP = DI] Closed 1. Themost important determinant of consumer spendingis (wealth/indebtedness/income). 2. Asaggregate income increases, consumption and saving both (increase/decrease). 3. The (consumption/saving) schedule shows how much households plan to consume at various income levels. 4. Dissaving occurs where consumption (exceeds/is less than) Y. 5. If the consumption schedule shifts upward [not caused by a tax change], the saving schedulewill shift (upward/downward). 6. (The expectation of a recession/A change in consumer incomes/ An expected change in the price level) will not cause the consumption curve to shift.
APCandAPS APC - percentage of income (“Y”) consumed. APC = C/Y(DI)=$48,000/$50,000 = .96 APS = S/Y(DI)= $2,000/$50,000 = .04 APS – percentage of income (“Y”) saved. AE=GDP APC=C/Y 1 APC = C/Y=$52,000/$50,000 = 1.04 APS = S/Y= -$2,000/$50,000 = -.04 1 ? “Econ, Econ, APS=S/Y “High maintenance Econ teacher”
ME=1/MPS MPC,MPS, & theMultiplier MPC - % change in Y consumed. MPS - % change in Y saved. MPC = C/ Y = $750/$1,000 = .75 MPS = S/ Y = $250/$1,000 = .25 Multiplier [1/MPS]=1/.25=$1/.25 = “M” of 4 [MPC is important for G in policy making decisions.] *The ME is the reciprocal of the MPS. The“M”works like a concentric circle.
The First Round of Government Spending Causes The Biggest SplashMPC of 75%G spends $200 billion on the highways. Highway workers save 25% of $200 billion [$50 billion] & spend 75% or $150 billion on boats. Boat makers save 25% of $150 bil. [$37.50 bil.] & spend 75% or $112.50 bil. on iPod Videos, etc.
ME = 1/MPS, 1/.25 = $1/.25 = ME of 4 ME is 4 & we are short of Y*[$860] by $60 billion o 45 AE[C+Ig+G] Equilibrium AE[C+Ig] AE[C+Ig+G](billions ) G= $15 Billion Incr G $15 +60 Recess. Spending gap Recess. Gap o Real GDP 800860 YrY* Recessionary GDP Gap “M” = Y/ E = 60/15 = 4
Now, let’s look at the Tax Multiplier [MT] MT = MPC/MPS, .75/.25 = ME of 3 MT is 3 & we are shortof Y*[$860]by $60 billion 3 x ? will close a $60 billion GDP gap? With this situation, [short of Y* by $60 bil.], we would need to decrease taxes by $20 billion, with a multiplier of3.
MT = MPC/MPS, .75/.25 = MT of 3 MT is 3 & we are short of Y*[$860] by $60 billion o 45 AE[C+Ig+G] Equilibrium AE[C+Ig] AE[C+Ig+G](billions ) Decr T $20 +60 Recess. Spending gap Recess. Gap o Real GDP 800860 YrY* Recessionary GDP Gap
ME = 1/MPS, 1/.50 = $1/.50 = ME of 2 ME is 2 & we are short of Y*[$860] by $60 billion o 45 AE[C+Ig+G] Equilibrium AE[C+Ig] AE[C+Ig+G](billions ofdollars) G= $30 Billion + 30 G +60 Recess. Spending gap Recess. Gap o Real GDP 800 YR 860 Y* Recessionary GDP Gap “M” = Y/ E = 60/30 = 2
MT = MPC/MPS, .50/.50 = MT of 1 MT is 1 & we are short of Y*[$860] by $60 billion o 45 AE[C+Ig+G] Equilibrium Now, let’s look at correcting this $60 billion recessionary gap with a tax cut. MPS=.5 AE[C+Ig] AE[C+Ig+G](billions ofdollars) Decr. T by $60 +60 Recess. Spending gap Recess. Gap o 800 YR Real GDP 860 Y* Recessionary GDP Gap
ME = 1/MPS, 1/.50 = $1/.50 = ME of 2 ME is 2 & we are beyond Y*[$840] by $40 billion o 45 AE[C+Ig+G] 2 x -? = -40 AE[C+Ig-G] Equilibrium Inflationary Spending gap=$20 B AE[C+Ig+G](billions ofdollars) -20 G -40 Inflat. Gap o Real GDP 840 880 Y*YI Inflationary GDP Gap
MT = MPC/MPS, .50/.50 = MT of 1 MT is 1 & we are beyond Y*[$840] by $40 billion o 45 AE[C+Ig+G] AE[C+Ig+G] Equilibrium Now, with a MT of 1, we would need a tax increase of how much to close the $40 bil. inflationary gap? AE[C+Ig+G](billions ofdollars) Incr T $40 1 x -? = -40 -40 Inflat. Gap o Real GDP $40 billion tax increase 840 880 Y*YI Inflationary GDP Gap
MPC 1/MPS = ME .90 1/.10 = 10 .80 1/.20 = 5 .75 1/.25 = 4 .60 1/.40 = 2.5 .50 1/.50 = 2 ME [Change in G, Ig, or Xn] = 1/MPS
MT [Change in Taxes] = MPC/MPS MPC MPC/MPS = MT .90 MPC/.10 = 9 .80 MPC/.20 = 4 .75 MPC/.25 = 3 .60 MPC/.40 = 1.5 .50 MPC/.50 = 1 When the G gives a tax cut, the MT is smaller than the ME because a fraction [MPS] is saved and only the MPC is initially spent. So, the MT= MPC/MPS.
INSTRUCTIONS FOR THE NEXT FOUR AE SLIDES • We willstart at $500 equilibrium GDPon each. • Of the three items(equilibrium GDP, change • in expenditures, and MPC), you will be given • two and if you know two you can always figure • out the 3rd. For instance if you knew that • equilibrium GDP increased by $400 and the • multiplier was 4, then the change in expenditures • was obviously $100. • Except for 6, 9, 15, & 18, you will increase • equilibrium GDPabove $500, because there • is an increase in G, or a decrease in T, or • an equal increase in G&T. • Ex: With MPC of .75 & therefore a ME of 4, • an increase in G of $20 means $20 x 4 = $580 • 4. On questions 6, 9, 15, & 18, you will decrease equilibrium • GDP below $500 because you are either decreasing G, • increasing T, or there is an equal decrease in G & T. • Ex: With MPC of .75 & therefore a ME of 4, a decrease • in G of $20 means -$20 x 4 = $420. Inflationary spending gap AE AE2 AE1 AE3 E2 E1 E3 500 Recessionary spending gap Inflationary GDP gap Recessionary GDP gap
The Multiplier & Equilibrium GDP [Give the correct equilibrium GDP [start from $500] using the ME, MT, MBB] MT = MPC/MPS [Chg in T ] MBB = 1 [G&T ] ME=1/MPS [chg in G, Xg, or Xn] [+G] 1. ME = ____ [-T] 2. MT = ____ [+G&T] 3. MBB =____ 540 S 520 Inflationary Spending gap AE1 AE2 AE3 AE E2 520 E1 Chg in Equilibrium GDP ___ Y with ME ____Y with MT ____Y withMBB 40 E3 20 20 ME__ MT___ MBB___ 2 MPC [So MPS & ME, MT, & MBB] $20 Change in Expenditures $500 Recessionary Spending gap .50 1 1 [+G] 1. ME = ____ [-T] 2. MT = ____ [+G&T] 3. MBB =____ MT’s MPC M .90 = 9 .87.5= 7 .80 = 4 .75 = 3 .60 =1.5 .50 = 1 ME’s [G,Ig,Xn] MPC M .90 = 10 .87.5= 8 .80 = 5 .75 = 4 .60 =2.5 .50 = 2 [+G] 1. ME = ____ [-T] 2. MT = ____ [+G&T] 3. MBB =____ [+G] 1. ME = ____ [-T] 2. MT = ____ [+G&T] 3. MBB =____ 600 700 560 590 548 650 510 512 550 2 3 1 $100 Y with ME ___Y with MT ___Y withMBB $200 Y with ME _____Y with MT _____Y withMBB ____ Y with ME ____Y with MT ____Y withMBB 60 90 150 48 10 50 12 ME__ MT___ MBB___ ME__ MT___ MBB___ .9 10 5 ME__ MT___ MBB___ 4 $10 .80 $12 4 9 .75 3 $50 ? 1 1 1
[-G] 1. ME = ___ [+T] 2. MT =___ [-G&T]3.MBB=___ [+G] 1. ME = ____ [-T] 2. MT = ____ [+G&T] 3. MBB =____ 600 [+G] 1. ME = ____ [-T] 2. MT = ____ [+G&T] 3. MBB =____ 550 460 Here are a few helpers… try the rest on your own 550 465 530 550 520 495 4 5 ___ Y with ME ____Y with MT ____Y with MBB 50 6 100 ___ Y with ME ____Y with MT ____Y with MBB -40 ___ Y with ME ____Y with MT ____Y with MBB 30 50 -35 20 50 -5 .60 .50 87.5 2 2.5 ME__ MT___ MBB___ ME__ MT___ MBB___ 8 ME__ MT___ MBB___ $20 1 $50 1.5 7 -$5 1 1 1 [-G] 1. ME =___ [+T] 2. MT =___ [-G&T]3.MBB=___ 575 [+G] 1. ME = ____ [-T] 2. MT = ____ [+G&T] 3. MBB =____ [+G] 1. ME = ____ [-T] 2. MT = ____ [+G&T] 3. MBB =____ 300 900 560 320 800 515 480 600 7 8 9 -200 75 ___ Y with ME ____Y with MT ____Y with MBB ___ Y with ME ____Y with MT ____Y with MBB ___ Y with ME ____Y with MT ____Y with MBB 400 60 -180 300 15 100 -20 .80 .9 .75 5 10 ME__ MT___ MBB___ 4 ME__ MT___ MBB___ ME__ MT___ MBB___ $15 4 -$20 9 $100 3 1 1 1
Here are a few helpers… try the rest on your own [+G]1.ME= ___ [-T]2.MT=___ [+G&T]3.MBB=___ [+G] 1. ME = ____ [-T] 2. MT = ____ [+G&T] 3. MBB =____ 540 [+G] 1. ME = ____ [-T] 2. MT = ____ [+G&T] 3. MBB =____ 512.5 550 538 540 507.5 502 505 510 10 11 __._ Y with ME _.___Y with MT __ with MBB 125 12 40 ___ Y with ME ____Y with MT ____Y with MBB 50 ___ Y with ME ____Y with MT ____Y with MBB 75 38 40 50 2 10 .95 .60 ? ? 20 ME__ MT___ MBB___ 5 ME__ MT___ MBB___ 2.5 ME__ MT___ MBB___ $5 $2 $10 19 4 1.5 1 1 1 [-G] 1. ME =___ [+T] 2. MT =___ [-G&T]3.MBB=___ 560 [+G] 1. ME = ____ [-T] 2. MT = ____ [+G&T] 3. MBB =____ [+G] 1. ME = ____ [-T] 2. MT = ____ [+G&T] 3. MBB =____ 420 700 545 430 600 515 490 600 13 14 15 -80 60 ___ Y with ME ____Y with MT ____Y with MBB ___ Y with ME ____Y with MT ____Y with MBB ___ Y with ME ____Y with MT ____Y with MBB 200 45 -70 100 15 100 -10 87.5 .75 .50 8 4 ME__ MT___ MBB___ 2 ME__ MT___ MBB___ ME__ MT___ MBB___ $15 -$10 7 $100 3 1 1 1 1
532 [-G] 1. ME = ___ [+T] 2. MT =___ [-G&T]3.MBB=___ [+G] 1. ME = ____ [-T] 2. MT = ____ [+G&T] 3. MBB =____ 625 [+G] 1. ME = ____ [-T] 2. MT = ____ [+G&T] 3. MBB =____ 400 524 600 410 508 525 490 16 17 18 32 125 ___ Y with ME ____Y with MT ____Y with MBB -100 ___ Y with ME ____Y with MT ____Y with MBB ___ Y with ME ____Y with MT ____Y with MBB 24 100 -90 8 25 -10 .75 .80 .9 4 10 ME__ MT___ MBB___ 5 ME__ MT___ MBB___ ME__ MT___ MBB___ $8 $25 3 9 4 -$10 1 1 1