html5-img
1 / 0

Integrating Quality Metrics with Focused Interventions to Improve Medication Adherence

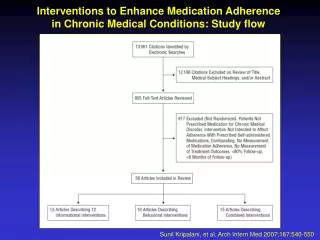
Integrating Quality Metrics with Focused Interventions to Improve Medication Adherence. Presentation Objectives. Present findings from a study conducted within community pharmacies that improved patient medication adherence; Discuss general strategies for improving medication adherence;

haruko
Download Presentation

Integrating Quality Metrics with Focused Interventions to Improve Medication Adherence

An Image/Link below is provided (as is) to download presentation Download Policy: Content on the Website is provided to you AS IS for your information and personal use and may not be sold / licensed / shared on other websites without getting consent from its author. Content is provided to you AS IS for your information and personal use only. Download presentation by click this link. While downloading, if for some reason you are not able to download a presentation, the publisher may have deleted the file from their server. During download, if you can't get a presentation, the file might be deleted by the publisher.

E N D

Presentation Transcript


  1. Integrating Quality Metrics with Focused Interventions to Improve Medication Adherence

  2. Presentation Objectives Present findings from a study conducted within community pharmacies that improved patient medication adherence; Discuss general strategies for improving medication adherence; Discuss implications of study for new healthcare delivery models
  3. PA Collaborative and the ASPIRE Cloud Platform The Pennsylvania Collaborative Phase I Key Accomplishments Established technical approach for continuous data aggregation, exchange & measurement Established access to web-based performance reports insideof Rite Aid for both the pharmacist and Rite Aid as a system Created collaborative model for quality improvement, across disparate organizations that can serve as foundation for risk-share/P4P Identified that measurement alone has little impact on improvement Phase I and II Partners Stakeholder Role(s) Data Aggregator & Data Provider Technology Platform Provider & Integrator Healthcare Professionals Provider Organization Measure Provider Phase II Partners Stakeholder Role(s) Intervention Strategy And Research Provider Performance Payment Program
  4. The Vision for Phase II Moving from Measurement to Improvement Next Phase Add Incentives & Communities of Practice And Learning Link Learning to Performance Gaps; Align Incentives; Make it Personal & Wrap Social Networks to Scale & Spread Improvement Phase II Identify Gaps & Link to Improvement Phase I Performance Measurement Only Feed Forward Feed Back For Improvement Communities of Practice & Communication Networks Next Phase Add Incentives & Communities of Practice And Learning
  5. Performance Measures Now and in the Future PQA Proportion of Days Covered (PDC) Metric - Compliance/adherence ACEI/ARB medications Lipid-modifiers (statins) Diabetes oral medications Calcium channel blockers Asthma controller therapy ACEI/ARB in diabetics with hypertension High-Risk Medications in the Elderly Drug-Drug Interactions 5
  6. ASPIRE Phase II from Measurement to Improvement Transforming Pharmacy Practice to Optimize Patient Outcomes Secure virtual private network HIPAA compliant Performance Reports with Peer Comparisons Three simple steps to move from measurement to improvement
  7. ASPIRE Phase II “How Do I Improve?” Gaps in Measures Drives Link to Interventions Performance Goals Established By Highmark Dynamic Peer Comparisons
  8. ASPIRE Phase II…Continuous Performance Improvement Gaps in Measures Linked to Library of Interventions Interventions CECity Hosted Link to 3rd party hosted resources Connect to 3rd party Apps (e.g. MTM)
  9. ASPIRE Phase II...Key Value Points and Success Demonstrated
  10. What are the Drivers? Medicare Part D Star Ratings Medicare drug plans receive an overall rating on quality as well as scores in four domains; PQA measures are used in one of the domains National Business Coalition on Health evaluates health plans; PQA measures are used URAC accredits pharmacy benefit managers (PBMs), mail-service pharmacies and disease mgmt organizations; PQA measures are used NCQA accredits health plans and requires reporting of quality measures (some related to medications) 10
  11. The Health Plan PerspectiveWhere are we? Balancing cost, quality, and access Control/Reduce healthcare spend Improving quality of services for our members Incentive reimbursement programs (P4P) Model P4P or other incentives for pharmacies based on performance improvement Adaptation to changes in the market Medicare Plans - CMS STAR ratings PQA-endorsed metrics
  12. MedicareAdvantage plans have a new payment system in 2012 and beyond The star ratings will affect payment to Medicare Advantage plans wherein higher-rated plans get higher payment Quality Bonus Payments (QBPs) will be awarded on a sliding scale according to star ratings 2012 payments are based on 2012 ratings which were based on 2010 data for PDE-based measures Stand-alone Part D plans will have marketing advantages related to star ratings, but not QBPs Medicare Advantage Incentives
  13. 13 Quality Bonus Payments (QBPs) QBP is a percentage increase in payment to the plan above the standard rate. For plans with less than 5 stars, the standard rate may be capped at pre-ACA rates. For more details, https://www.cms.gov/MedicareAdvtgSpecRateStats/
  14. MedicareAdvantage plans are paid by CMS The expected difference in payments for a 3-star plan and 5-star plan is about $16 per member per month For a Medicare Advantage plan with 1 million members, moving from 3 to 5 stars would boost revenue by ~ $200 million PQA measures account for about 20% of the star rating for a Medicare Advantage plan that offers drug benefits In 2015, the demonstration is scheduled to end; QBPs will change to ACA-specified rates unless further changes occur (plans below 4 stars will not be eligible for QBPs) QBPs – Big Deal ?
  15. 2012 Benchmark: Medicare
  16. 2012 Star Thresholds MA-PD Plans
  17. There are implications for all As CMS and employers increase their scrutiny of quality of medication utilization, the health plans are asking PBMs to measure and improve quality. PBMs will be looking to their retail networks and pharmaceutical companies to help boost adherence. Plans, pharmacies and pharma companies can work together to drive improvements in medication-use quality, and improved medication adherence. Pharmacies and plans should share in the quality rewards (QBPs).
  18. The Intervention Strategy Aimed at improving professional practice and patient medication adherence Universal Screening: Identify patients at high or moderate risk of non-adherence Intervention: Pharmacists trained in motivational interviewing techniques aimed at facilitating positive relationships with at-risk patients with the goal of successfully affecting a behavior change Targeted PI: Links to online resources/CE with evidence-based guidelines targeted at the PQA PDC measures
  19. Phase II Results Summary of Preliminary Findings Total Pharmacies in Analysis = 117 Number of pharmacies included in Phase II Analysis Monthly Data Cycles Included in Analysis = 1 through 9, 12 Note: Currently on Cycle 13, but analysis included cycles 1-9 and 1-12. Total Patients/Rxs in Denominator = 46,500/month (9) 46,100/month (12) Number of patients/prescriptions included in the denominator across PQA measures included in Phase II analysis Note 1: Benchmarks set before study based on average adherence rate across all Highmark patients Note 2: The data analyzed does not include patients excluded by the measures, or those covered by other health plans, which also may have benefited from the global Phase II performance improvement initiatives
  20. Percentage of Pharmacies above Benchmark by Drug Category
  21. Demonstrated Success in Scaling Improvement Across the System
  22. Statistics for ACE Inhibitors 72% Benchmark Percent Minimum Median Maximum Minimum Median Maximum Cycle 1 Cycle 9
  23. Percentage of Medication Categories above Benchmarks Mean Cycle 1 = 2.8 Mean Cycle 9 = 3.1
  24. Implementation Survey Questions
  25. Implementation Survey Questions
  26. Intervention vs. Control Group At baseline, the intervention and control stores did not differ with respect to the percent of patients who met the PDC metric for each medication class. The analyses followed a repeated measures (panel) design. The statistical models evaluated potential time trends using first- and higher-order polynomials. This is a robust method for analyzing change in adherence rates over time across multiple groups; Trend over time is a better indicator of current and potential improvement in outcomes. Quadratic and cubic curves can better model trends since the change in adherence rates was not just a simple linear increase
  27. Intervention vs. Control Group Intervention stores experienced significantly greater improvement in adherence rates compared to control group stores for most categories of medications. ACEI/ARBs, Beta-Blockers, Calcium Channel Blockers, and Diabetes Medications all showed improvement. Changes in medication adherence in the intervention stores happened over time and accumulated.
  28. ACEI/ARB Example (Across All Stores) For 118 intervention stores, there were 11,342 people identified as having a prescription for ACEI/ARBs Each month, approximately 33 additional patients achieved PDC-80 threshold (i.e., became adherent) or almost 400 more adherent patients per year Caveat: The curvilinear trend would eventually reach a saturation point.
  29. Conclusions: Implementation Successful Collaborative Model Scalable Technical Approach Successful Web-Based Cloud Platform Successful Quality Metric Aggregation Successful Stores Used Platform More
  30. Conclusions: Implementation Implementation is supported by the concepts of: Strong organizational leadership support Updated and relevant performance measures Continuous learning Continuous quality improvement efforts Sound and feasible intervention Minimal resources and related expense
  31. Conclusion: Impact on Adherence Patient adherence for ACE/ARBs, Beta-Blockers, Calcium Channel Blockers and Diabetes medications were all significantly greater in intervention stores compared to the control stores. Improvements in medication adherence observed in the intervention stores accumulated over time The observed intervention impact on the ACE/ARBs demonstrates that the effect on adherence when multiplied over a patient population can add up to a significant number of positively affected patients
  32. Conclusion: Future Work Future work will examine how well the intervention effect is sustained, if the accumulated impact results in further improvements, and whether the positive impact on adherence translates to decreased healthcare utilization (and perhaps medical costs ). The potential impact of Highmark modeling a pay-for-performance program to this intervention will also be explored.
  33. What’s Next? Launching the EQuIPP Initiative…
  34. Quality Improvement Drivers HHS Consumers Employers Medicare Metrics NCQA URAC ONC,HRSA CDC,AHRQ FDA Medicaid Plans & PBM Medicare Plans & PBM Commercial Plans & PBM Consultant & Vendors E-QuIPP Pharmacies
  35. E-QuIPP Initiative EQuIPP = Electronic Quality Improvement Platform for Plans & Pharmacies The EQuIPP Initiative is built on the model from the Pennsylvania demonstration wherein a health plan and pharmacies collaborated on quality improvement During 2012, the “beta phase” for the E-QuIPP Initiative will allow health plans and pharmacies in Pennsylvania, Florida and Alabama to view quality scores and benchmarks, and use tools for no cost
  36. EQuIPP Services during Beta Phase Health Plans Plan-level scores and benchmarks on selected PQA measures for target states Pharmacy-level reports for network pharmacies in target states Pharmacies Pharmacy scores on PQA measures compared to peers Pharmacy scores on PQA measure by insurance mix Pharmacy organization management report Access to a base library of tools/resources for improvement
  37. EQuIPP Beta Phase Pennsylvania Highmark, UPMC, Gateway, HealthSpring Rite Aid, CVS, Giant Eagle, Target, Walmart and ~50 independent pharmacies Florida Humana, United, Wellcare, Capital, HealthSpring, BCBS-FL Alabama Humana, United, Healthspring, BCBS-AL FL/AL Pharmacies: CVS, Target, RiteAid, Walmart, WinnDixie and ~50 independent pharmacies
  38. Performance Information Flow Data Reports 38
  39. Initial Focus is on PQA measures used by CMS: 3 measures of medication adherence (PDC) Oral diabetes medications Cholesterol medication (statins) Blood pressure (renin-angiotensin system antagonists) 3 measures of medication safety High risk medications in the elderly Appropriate treatment of blood pressure in persons with diabetes Drug-drug interactions (from display measure set) EQuIPP Quality Measures
  40. Home Page - www.equipp.org 40
  41. Pharmacy Performance Report 41 PQA
  42. Pharmacy Analyze Performance 42
  43. Pharmacy Organizational Report 43
  44. Health Plan Report 44
  45. Health PlanAnalyze Performance 45
  46. Implications for Future Healthcare Models Bundled cost – community collaborative models Embedded care models Preferred networks (risk and nonrisk bearing)
  47. Thank You

    Questions
  48. Presenter & Collaborator Contact Information Jan Pringle, PhD University of Pittsburgh jlp127@pitt.edu (412) 904-6127 Maureen Bieltz Highmark Maureen.Bieltz@highmark.com 412-544-4627 Annette Boyer, RPh CECity.com, Inc. aboyer@cecity.com 412-338-0366 ext 312 David Nau, PhD Pharmacy Quality Alliance dnau@pqaalliance.org 859-537-8462
More Related