Download
1 / 42
420 likes | 603 Views
Office Hours: Survey Design. Scott Fricker Jean E. Fox Office of Survey Methods Research Bureau of Labor Statistics July 25, 2013. Are there online survey constructing tools that offer standards and best practices?. Online Survey Tool Templates.

E N D
Office Hours:Survey Design Scott Fricker Jean E. Fox Office of Survey Methods Research Bureau of Labor Statistics July 25, 2013
Are there online survey constructing tools that offer standards and best practices?
Online Survey Tool Templates • A number of online survey tools offer templates and best practices* • SurveyMonkey, SurveyGizmo, Qualtrics, Zoomerang, etc. • http://www.surveymonkey.com/mp/survey-templates/ • http://www.qualtrics.com/blog/customer-satisfaction-survey-questions/ • GSA resources *caveat lector
What are rules for inviting survey participants that will avoid bias?
Avoiding Bias • Use appropriate sampling method (e.g., simple random sampling; stratified by key target groups; etc.) • May not always be an option with your customer satisfaction surveys • Accept that the sample is self-selected • Consider that in your analysis • Report who does respond • Be sure that materials (invitations, reminders, questions) are not biased
Increasing Response Rates • Provide a good motivation to respond • Say you’ll improve the website, improve the transaction process, etc. • Give them something in return, like a link to data • If appropriate, send a follow-up email or two • Don’t make the survey too long or difficult.
How many survey responses are considered (generally) adequate to consider the results reliable?
Responses Needed • Determinants • Coverage/representativeness – identifying the population(s) of interest • Margin of error (confidence interval) • Confidence level (99% confident? 95%?) • Type of analyses (e.g., by sub-group)
Responses Needed (2) • Margin of error • For simple random samples, a good, rough estimate is given by: 1/√N • Sample size requirement
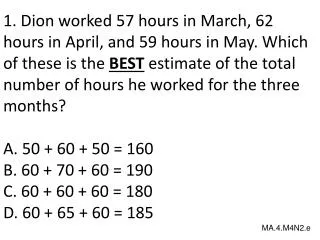
Is there data on whether questions are better than statements? For example: What is your name? vs Enter your name:
Questions vs Statements • On forms: Keep the label as short as possible. • Use just a label, not a whole instruction (so “Name” or “First Name” rather than “Enter your name”). • On surveys: Statements usually leads to Agree/Disagree questions, which are better to avoid. But if that's not the case, statements are probably okay.
Can we assume the distance between “somewhat satisfied” and “satisfied” is perceived as the same as between “satisfied” and “very satisfied” in the respondent's mind if you don't number them explicitly?
Numbering Responses • There are two issues here: • Labeling of response options • Verbal only • Numeric only • Both numeric and verbal • Amount of labeling (all points, only ends, etc.) • Analysis of Likert-type items
Labeling Response Options • Goal: confer meaning and increase reliability • Verbally labeling all options increases reliability (compared to end-points only) • Nonverbal elements will affect response • Numbers; symbols; layout • Numeric labels imply interval scale • Negative numbers should be avoided
Analysis of Likert Items • Likert-type items are ordinal • There is no true measure of distance between categories • Camp 1: means, standard deviations, Pearson correlations, etc. are not appropriate! • Camp 2: use of symmetrical categories about a midpoint and clearly defined labels makes them behave like an interval-level measurement • “Safe” analysis techniques • Frequencies, chi-squared statistics, median, range, measures of association for ordinal variables, etc.
Alternative to Likert Items • Visual Analog Scales (VASs)
If you're using text labels for all your responses and no numbers, how do you quantify the responses? Or should you add numbers to the responses?
Coding Responses • A “Camp 2” question? • Assuming you have a reliable Likert-type item with symmetrical categories: • Simply assign numeric codes to responses during analysis, e.g.: • “Very dissatisfied” = 1 • “Somewhat dissatisfied” = 2 • … • ”Very satisfied” = 5
What's your opinion about requiring responses to some or all Qs?
Requiring Responses • Sometimes necessary • Screeners • Skip patterns • Key data • Don’t require responses if the question is not necessary. • Honestly consider what is necessary.
Requiring Responses • Consider checks for missing items • Give respondents an opportunity to respond, but don’t force them to. • Be careful with checks that look for consistent responses to multiple items. • YOU may not think they are consistent, but the respondent may.
Multi- vs Single page • Previously--multiple pages avoided scrolling, which was good. • Now, people can scroll, so it’s ok. • Multiple pages: • Keeps each page simpler • Allows for automated skip patterns • Longer pages • Allows respondents to see more • Better when validation checks need to compare multiple entries
When evaluating a survey question, if 4 out of 5 people think it's okay, but 1 doesn't understand it, do you change the question?
What is a problem? • Age-old usability question: How many people have to experience a problem for designers to consider addressing it? • Sometimes, just one • In this situation, 20% will fail. • But, consider: • How badly did the participant misunderstand it? • Was the participant appropriate?
What is a good way to analyze qualitative data (i.e. comments) and make it useful?
Analyzing Qualitative Data • Qualitative data: responses to open-ended questions • Be sure you: • Want the data • Have the resources to analyze it
Analyzing Qualitative Data • Analyze with coding • Start with a small sample to identify codes • Add codes as needed as you go (you may need to reclassify some early responses) • Level of detail depends on the purpose of the analysis • Is it enough to know positive versus negative responses? • What are you planning to do with the data?
Analyzing Qualitative Data • Consider organizing by target sub-groups • Consider cost/benefit of automated text analysis tools • Ex: Attensity, Clarabridge, Overtone, IBM SPSS Text Analytics, SurveyMonkey, LIWC • Interest in and use of text analytics is on the rise • Powerful but can be resource intensive
Do the survey best practices translate to other data collection methods such as reports, registration forms, etc?
Other Data Collection • Many best practices translate: • keep the form as short as possible; only ask for what you need • use clear labels • size text fields appropriately • consider paging options • test before deploying
Length • Many questions, but also: • Questions appear to be repeated • Value of information is questionable • Consider a Question Protocol to evaluate: • Who needs each question • How they will use the results • Response options • Other metadata, such as validation checks, whether it’s required, etc.
Flow • Questions jump between topics and levels of detail. • Suggestions: • Group they questions by topic • Provide headers to break up large surveys • Arrange the topics in a logical order, but also consider • Key data (ask early) • Sensitive data (ask later) • Level of detail (ask general questions first)
Response Options • Surveys should be a conversation between you and the respondent. • Provide appropriate conversational responses to the questions.
Response Options • Make sure the responses are parallel, too.
Jean E. Foxfox.jean@bls.gov Scott S. Frickerfricker.scott@bls.gov