Download
1 / 1
10 likes | 83 Views
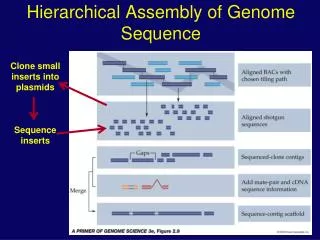
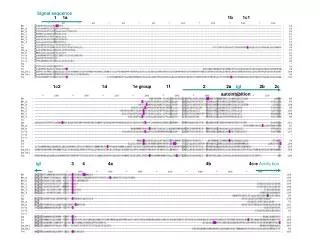
FLI. AA. 35.8. AC. 35.8. AG. 30.5. AT. 33.4. CA. 36.9. CC. 33.4. CG. 31.1. CT. 30.5. GA. 39.3. GC. 38.3. GG. 33.4. GT. 35.8. TA. 40. TC. 39.3. TG. 36.9. TT. 35.8. A new way of seeing genomes Combining sequence- and signal-based genome analyses.

E N D
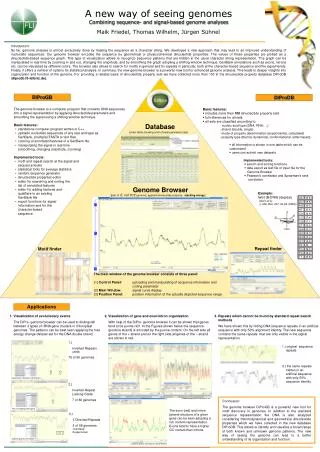
FLI AA 35.8 AC 35.8 AG 30.5 AT 33.4 CA 36.9 CC 33.4 CG 31.1 CT 30.5 GA 39.3 GC 38.3 GG 33.4 GT 35.8 TA 40 TC 39.3 TG 36.9 TT 35.8 A new way of seeing genomes Combining sequence- and signal-based genome analyses Maik Friedel, Thomas Wilhelm, Jürgen Sühnel Introduction: So far, genome analysis is almost exclusively done by treating the sequence as a character string. We developed a new approach that may lead to an improved understanding of nucleotide sequences. Our genome browser encodes the sequence by geometrical or physicochemical dinucleotide properties. The values of these properties are plotted as a dinucleotide-based sequence graph. This type of visualization allows to recognize sequence patterns that are hidden in the usual character string representation. The graph can be manipulated in real time by zooming in and out, changing the amplitude, and by smoothing the graph adopting a shifting window technique. GenBank annotations such as exons, introns etc. can be visualized by different colors. The browser also allows to search for motifs in general and for repeats in particular, both at the character-based sequence and the signal levels. Finally, it offers a number of options for statistical analysis. In summary, the new genome browser is a powerful new tool for enhanced genome analysis. This leads to deeper insights into organization and function of the genome. For providing a reliable basis of dinucleotide property sets we have collected more than 100 in the dinucleotide property database DiProDB (diprodb.fli-leibniz.de). DiProGB DiProDB • The genome browser is a computer program that converts DNA sequences into a signal representation by applying dinucleotide parameters and smoothing the signal using a shifting window technique. • Basic features: • standalone computer program written in C++ • uploads nucleotide sequences of any size and type as GenBank, (multiple) FASTA or text files • coloring of annotated features of a GenBank file • manipulating the signal in real time • (smoothing, changing amplitude, zooming) • Implemented tools: • motif and repeat search at the signal and sequence levels • statisticaltools for average statistics • random sequence generator • dinucleotide properties editor • editor for searching and sorting the • list of annotated features • editor for adding features and • qualifiers to an existing • GenBank file • export functions for signal • information and for the • character-based • sequence • Basic features: • includes more than 100 dinucleotide property sets • full references for all sets • all sets are classified according to: • nucleic acid type (DNA, RNA, ...) • strand (double, single) • mode of property determination (experimental, calculated) • property type (thermo dynamical, conformational, letter based) • all information is shown in one table which can be customized • users can submit own datasets Implemented tools: • search and sorting functions • data export as text file or input file for the Genome Browser • Pearson’s correlation and Spearman’s rank correlation Database (main table showing a list of twist parameter sets) Genome Browser Example: twist (B-DNA) [degree] (Gorin et al. J. Mol. Biol. 247, 34-48 (1995)). (part ofE. coli K12 genome; applied dinucleotide property: stacking energy) Repeat finder Motif finder The main window of the genome browser consists of three panel: (1) Control Panel: uploading and manipulating of sequence information and coding parameter (2) Main Window: signal curve display (3) Position Panel: position information of the actually depicted sequence range Applications 1. Visualization of evolutionary events The DiPro- genome browser can be used to distinguish between 3 types of rRNA gene clusters in chloroplast genomes. The patterns can be best seen applying the free energy change dataset set for the DNA double strand. 2. Visualization of gene and exon/intron organization With help of the DiPro- genome browser it can be shown that genes tend to be purine-rich. In the Figures shown below the sequence (positive strand) is encoded by the purine content. On the left side all genes of the + strand and on the right side all genes of the – strand are shown in red. 3. Repeats which cannot be found by standard repeat search methods We have shown this by hiding DNA sequence repeats in an artificial sequence with only 50% alignment identity. The new sequence contains the same repeats that are only visible in the signal representation. 1.) Inverted Repeats (25kB) 79 of 88 genomes 1.) original sequence repeats 2.) the same repeats hidden in an artificial sequence with only 50% sequence identity Saccharum officinarum chloroplast 2.) Inverted Repeat Lacking Clade 7 of 88 genomes Ureaplasma parvum serovar 3 str. Conclusion: The genome browser DiProGB is a powerful new tool for motif discovery in genomes. In addition to the standard sequence representation the DNA is also analyzed considering thermodynamical and geometrical dinucleotide properties which we have collected in the new database DiProDB. This allows to identify and visualize a broad range of both known and unknown genome patterns. The new way of seeing the genome can lead to a better understanding of its organization and function. Pinus thunbergii chloroplast The exon (red) and intron (green) structure of a given gene can be seen adopting a GC content representation. Exons tend to have a higher GC content than introns. 3.) 3 Directed Repeats 2 of 88 genomes (subclass: Euglenozoa) Euglena gracilis chloroplast Euglena gracilis chloroplast (76235-81341)