Download
1 / 16
160 likes | 284 Views
Upper-Air Inter-Comparison Experiment Update. Presented By Philippe Peylin on behalf of Christopher Pickett – Heaps & Peter Rayner. Purpose of the experiment…. An inter-comparison of forward transport using a common CO 2 flux field

E N D
Upper-Air Inter-Comparison Experiment Update Presented By Philippe Peylin on behalf of Christopher Pickett – Heaps & Peter Rayner
Purpose of the experiment… • An inter-comparison of forward transport using a common CO2 flux field • Use of non-surface CO2 data in the cross-validation of atmospheric CO2 inversion models • Focus on differences in forward simulations Methodology… • Single (common) CO2 flux field generated from the Baker et al. 2006 inter-comparison study inserted in the ATMs • Model CO2 concentration field sampled appropriately to compare to available CO2 measurements
Available CO2 measurements… • Non-Surface CO2 Airborne Data Archive : Consists of measurements from 39 aircraft campaigns • 27 short, intensive campaigns E.G. COBRA 2000, 2003, 2004 (Gerbig et al. 2003, Lin et al. 2006 and others), PEM-WEST A/B (Anderson et al. 1996, Hoell et al. 1997), PEM-TROPICS A/B (Hoell et al. 1999, Raper et al. 2001), BIBLE A (Machida et al. 2003) ), CRYSTAL (Xueref et al. 2004) and others • 12 long-term, regular campaigns E.G. Matsueda et al. (1999), NOAA/GMA profile data (Stephens et al. in press), Cape Grim profile data (Pak 2000, Langenfelds et al. 1996, 1999), CARIBIC (Brenninkmeijer et al. 2005) and others
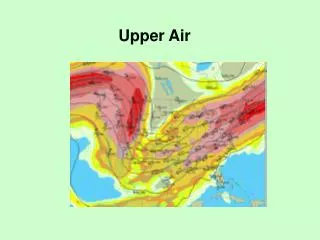
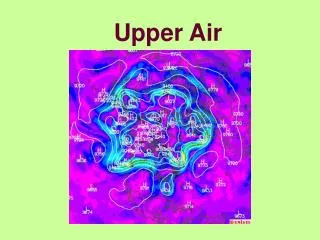
Altitude Variation (surf - ~21km) 21,6 km Surf Available CO2 measurements… • Non-Surface CO2 Airborne Data Archive • Temporal Coverage: 1987 – 2004 • Surface Lower Stratosphere • Majority of data within the free troposphere • Reasonable Global Coverage • Data concentrated over the Pacific Ocean and North America
Inter-comparison project: Current Status… All participating models required to: • Re-grid flux fields onto respective model grids • Run a forward simulation with analysed meteorology from 1988 – 2003 (or part thereof) • Use of ‘real winds’ • Sample the model CO2 conc. field at specified spatio-temporal locations
Inter-comparison project: Current Status… • Currently there are 4 participating ATMs • LSCE: LMDz (P. Bousquet) • CSIRO: CCAM (C. Pickett – Heaps & R. Law) • NIES: CCSR (P. Patra) (Not used yet !) • JMA: CTDM (T. Maki) • Colorado State Univ. will hopefully become a future participant • Current results are very preliminary (further analysis planed for this year)
Inter-comparison results to date… Analysis to date based on profile data: • Cape Grim Profile Data • Monthly vertical profiles over Cape Grim from 1991 – 2000, surface - ~7000m • CAR Profile Data • Weekly vertical profiles flown over CAR from 1992 – 2002, surface - ~7000m • For each profile… • RMS error and mean model bias (average residual) are calculated
CCAM LMDz CTDM CCAM LMDz CTDM Inter-comparison Results: RMS error/Model Bias average statistics & time-seriesCAR
Inter-comparison Results: RMS error/Resid seasonality CAR CCAM LMDz CTDM 6 6 • NOTE: Strong seasonality in RMS error in all forward simulations 3 0 0 -6 Jan Dec Dec Jan RMS error vs. Month Bias vs. Month
CCAM CI LMDz CI CTDM CI Inter-comparison Results: Seasonal Mean Residual Profiles CAR Dec-Jan-Feb Jun-Jul-Aug CI: Confidence Interval of mean model bias for different levels of the atmosphere • NOTE: Seasonal errors in the vertical gradient during summer (June – August) -4 4 -5 5
CCAM LMDz CTDM CCAM LMDz CTDM Inter-comparison Results: RMS error/Model Bias average statistics & time-seriesCAPE GRIM
CCAM LMDz CTDM 3 0 1.5 0 -3 Jan Dec Dec Jan RMS error vs. Month Bias vs. Month Inter-comparison Results: RMS error/Resid seasonality Cape Grim • NOTE: Strong seasonality in model bias within CCAM/CTDM fwd simul. but reduced seasonality in the LMDz fwd simul.
Mar-Apr-Mai Dec-Jan-Feb CCAM CI LMDz CI CTDM CI Jun-Jul-Aug Sep-Oct-Nov Inter-comparison Results: Seasonal Mean Residual Profiles Cape Grim
RANGE: 0.04ppm – >2ppm (6000m – 9000m) RANGE: 0.05ppm – >1.7ppm (9,000m – 12,000m) Inter-comparison Results: Variation across four modelsNon-Surface CO2 Airborne Data Archive (VERY PRELIMINARY!)
Future Plans… • Solve current problems in sampling conc. field with certain ATMs • Inclusion of results from more models • Extend inter-comparison to the entire upper-air archive • Perform extensive analysis of the Non-Surface CO2 Airborne Data Archive • Statistical/Climatological analysis
THANKS TO: • The LSCE & CMAR • Dr Peter Rayner, Dr Rachel Law, Dr Philippe Ciais, Dr Philippe Bousquet & Dr Philippe Peylin • All inter-comparison participants • All measurement campaign PIs who have contributed to the data archive • AND… sincere apologies that I am not able to attend the TRANSCOM meeting this year