Download
1 / 1
10 likes | 279 Views
Measurement of cardiac function using dual catheterization in the Dahl SS rat on low salt. Matthew D. Sanders, Shivendra Tewari , Terry Kurth , Robert P. Ryan, Allen W. Cowley Jr., Daniel A. Beard, Brian E. Carlson

E N D
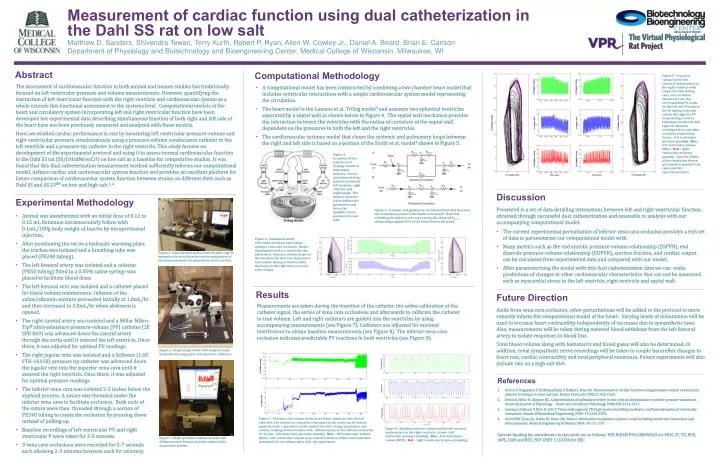
Measurement of cardiac function using dual catheterization in the Dahl SS rat on low salt Matthew D. Sanders, ShivendraTewari, Terry Kurth, Robert P. Ryan, Allen W. Cowley Jr., Daniel A. Beard, Brian E. Carlson Department of Physiology and Biotechnology and Bioengineering Center, Medical College of Wisconsin, Milwaukee, WI Abstract Computational Methodology Figure 9. Pressure-volume in the left ventricle and pressure in the right ventricle with respect to time during vena cava occlusion. Shown here are the corresponding PV loops. On the left are PV loops in the LV during occlusion and on the right are PV loops during recovery. Pink loops on the left and right are baseline readings before and after occlusion respectively. Green – left ventricular pressure (mmHg). Blue – left ventricular volume (RVU). Red – right ventricular pressure (mmHg). Note the ability of the simulation shown previously to qualitatively represent this experimental data. The assessment of cardiovascular function in both animal and human studies has traditionally focused on left ventricular pressure and volume measurements. However, quantifying the interaction of left ventricular function with the right ventricle and cardiovascular system as a whole extends this functional assessment to the systems level. Computational models of the heart and circulatory system incorporating left and right ventricular function have been developed but experimental data describing simultaneous function of both right and left side of the heart have not been previously measured and analyzed with these models. Here, we studied cardiac performance in rats by measuring left ventricular pressure-volume and right ventricular pressure simultaneously using a pressure-volume conductance catheter in the left ventricle and a pressure-tip catheter in the right ventricle. This study focuses on development of the experimental protocol and using it to assess normal cardiovascular function in the Dahl SS rat (SS/JrHsdMcwiCrl) on low salt as a baseline for comparative studies. It was found that this dual catheterization measurement method sufficiently informs our computational model, defines cardiac and cardiovascular system function and provides an excellent platform for future comparison of cardiovascular system function between strains on different diets such as Dahl SS and SS.13BN on low and high salt.1, 2 • A computational model has been constructed by combining a two chamber heart model that includes ventricular interactions with a simple cardiovascular system model representing the circulation. • The heart model is the Lumens et al. TriSeg model3 and assumes two spherical ventricles separated by a septal wall as shown below in Figure 4. The septal wall mechanics provides the interaction between the ventricles with the radius of curvature of the septal wall dependent on the pressures in both the left and the right ventricles. • The cardiovascular systems model that closes the systemic and pulmonary loops between the right and left side is based on a portion of the Smith et al. model4 shown in Figure 5. Figure 4. Geometry of the Lumens et al. TrigSeg3 model of ventricular function. Forces are balanced at the junctions between left ventricle, right ventricle and septal walls. The balance between forces defines the geometries and hence the myofiber stress produced in each wall. Discussion Experimental Methodology • Presented is a set of data detailing interactions between left and right ventricular function, obtained through successful duel catheterization and amenable to analysis with our accompanying computational model. • The current experimental perturbation of inferior vena cava occlusion provides a rich set of data to parameterize our computational model with. • Many metrics such as the end systolic pressure-volume relationship (ESPVR), end diastolic pressure-volume relationship (EDPVR), ejection fraction, and cardiac output can be calculated from experimental data and compared with our model. • After parameterizing the model with this dual catheterization data we can make predictions of changes in other cardiovascular characteristics that can not be measured such as myocardial stress in the left ventricle, right ventricle and septal wall. Figure 5. Systemic and pulmonary circulation fluid flow based on the circulation portion of the Smith et al model4. Note that occluding the inferior vena cava essentially shuts off Rivc,d, eliminating roughly 60% of the blood flow to the heart. • Animal was anesthetized with an initial dose of 0.12 to 0.15 mL Ketamine intramuscularly follow with 0.1mL/100g body weight of Inactinby intraperitoneal injection. • After positioning the rat on a hydraulic warming plate, the trachea was isolated and a breathing tube was placed (PE240 tubing). • The left femoral artery was isolated and a catheter (PE50 tubing) fitted to a 0.05% saline syringe was placed to facilitate blood draw. • The left femoral vein was isolated and a catheter placed for blood volume maintenance. Infusion of the saline/albumin mixture proceeded initially at 1.0mL/hrand then increased to 3.0mL/hrwhen abdomen is opened. • The right carotid artery was isolated and a Millar Mikro-Tip® ultra-miniature pressure-volume (PV) catheter (2F, SPR 869) was advanced down the carotid artery through the aorta until it entered the left ventricle. Once there, it was adjusted for optimal PV readings. • The right jugular vein was isolated and a SciSense (1.6F, FTH-1611B) pressure tip catheter was advanced down the jugular vein into the superior vena cava until it entered the right ventricle. Once there, it was adjusted for optimal pressure readings. • The inferior vena cava was isolated 2-3 inches below the xyphoid process. A suture was threaded under the inferior vena cava to facilitate occlusion. Both ends of the suture were then threaded through a section of PE240 tubing to create the occlusion by pressing down instead of pulling up. • Baseline recordings of left ventricular PV and right ventricular P were taken for 3-5 minutes. • 3 vena cave occlusions were recorded for 5-7 seconds each allowing 2-3 minutes between each for recovery. Figure 6. Simulation of left ventricular pressure and volume during a vena cava occlusion. Model is parameterized as a mouse for this simulation. Pressure volume loops on the left show the decrease in pressure and volume during occlusion while the loops on the right show recovery after release. Figure 1. Experimental station with Faraday cage to minimize electrical interference in anticipation of later measurements of sympathetic nerve activity. Results Future Direction Measurements are taken during the insertion of the catheter, the saline calibration of the catheter signal, the series of vena cava occlusions and afterwards to calibrate the catheter to true volume. Left and right catheters are guided into the ventricles by using accompanying measurements (see Figure 7). Catheters are adjusted for minimal interference to obtain baseline measurements (see Figure 8). The inferior vena cava occlusion indicates predictable PV reactions in both ventricles (see Figure 9). Aside from vena cava occlusion, other perturbations will be added to the protocol to more robustly inform the computational model of the heart. Varying levels of dobutamine will be used to increase heart contractility independently of increases due to sympathetic tone. Also, measurements will be taken during metered blood withdraw from the left femoral artery to isolate responses in blood loss. Total blood volume along with hematocrit and blood gases will also be determined. In addition, renal sympathetic nerve recordings will be taken to couple baroreflex changes to heart rate, cardiac contractility and total peripheral resistance. Future experiments will also include rats on a high salt diet. Figure 2. Surgical apparatus with surgical scope, hydraulic warming plateand inputs for catheters. References Pacher P, Nagayama T, Mukhopadhyay P, Batkai S, Kass DA. Measurement of cardiac function using pressure-volume conductance catheter technique in mice and rats. Nature Protocols 2008;3:1422-1434. Deten A, Millar H, Zimmer HG. Catheterization of pulmonary artery in rats with an ultraminiature catheter pressure transducer. American Journal of Physiology - Heart and Circulatory Physiology 2003;285:2212-2217. Lumens J, Delhaas T,Kirn B,Arts T. Three-wall segment (TriSeg) model describing mechanics and hemodynamics of ventricular interaction. Annals of Biomedical Engineering 2009: 37:2234-2255. Smith BW, Chase JG, Nokes RI, Shaw GM, Wake G. Minimal haemodynamic system model including ventricular interaction and valve dynamics. Medical Engineering & Physics 2004: 26:131-139. Figure 7. Pressure and volume in the aorta before insertion into the left ventricle. The volume as a function of pressure in the aorta can be used to quantify aortic capacitance in the model. Note the change in pressure and volume readings between times 350 – 400 (seconds) as the catheter enters the LV. Green– left ventricular pressure (mmHg). Blue – left ventricular volume (RVU). Left ventricular volume is recorded in relative volume units and then translated to real volume units after the experiment. Figure 8. Baseline pressure-volume in the left ventricle and pressure in the right ventricle. Green – left ventricular pressure (mmHg). Blue – left ventricular volume (RVU). Red – right ventricular pressure (mmHg). Current funding for contributors to this work are as follows: NIH NiGMS P50 GM094503 for MDS, ST, TK, RPR, AWC, DAB and BEC; NSF CBET 1133260 for BEC Figure 3. Millar pressure-volume system with ADInstrumentsPowerLabmulti-channel data acquisition system.