Download
1 / 29
290 likes | 314 Views
Explore the research on the relationship between visual-spatial ability and achievement on PISA reading literacy units in Serbia. The study delves into the associations, hypotheses, variables, and sample characteristics, focusing on data collection methods and data presentation using statistical analyses.

E N D
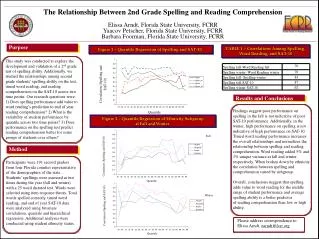
“Dijalozi u obrazovanju 2018” The Relationship between Visual-Spatial Ability and Achievement on PISA Reading Literacy Dejana Mutavdžin, Luminis d.o.o. Privredno društvo za obrazovni konsalting
Introduction – Formulation of the Research Problem Key findings of a research conducted in Serbia (Mutavdžin, 2015), speak in favor of a nonlinear association between visual-spatial ability and linear text reading skill, designated as a continuous dimension. As linear texts prevail in Serbian textbooks, these findings may imply that educational needs of one group of students remain unrecognized. Despite several decades of research efforts, there is no straightforward answer to the question of the relationship between visual-spatial ability and reading disability.
Research Topic: The relationship between visual-spatial ability and achievement on PISA reading literacy units.
Research Question: What are the achievements on PISA reading literacy units of subjects with high visual-spatial abilities?
Aim of the research: The aim of the research was to determine whether there is an association between visual-spatial ability and achievement on PISA reading literacy units, and if so what is its type and intensity.
Hypotheses: H1:There is a positive association between visual-spatial ability and achievement on PISA reading literacy units. H2:Subjects with higher visual-spatial abilities score lower on PISA units with linear text format, than subjects with lower visual-spatial abilities. H3:Subjects with higher visual-spatial abilities score higher on PISA units with nonlinear text format, than subjects with lower visual-spatial abilities. H4:Subjects with high visual-spatial abilities score higher on PISA units with nonlinear than on units with linear text format.
Variables Control variables: subjects’ sex; the presence of vision correction; familiarity with PISA reading literacy units; experience with different types of text format in school context. *Categorical variables. Dependent variable: achievement on PISA reading literacy units; • achievement on PISA reading literacy units with linear text format; • achievement on PISA reading literacy units with nonlinear text format. *Continuous variable. Independent variable: visual-spatial ability; • general visualization; • spatial visualization. *Continuous variable. Moderating variable: general cognitive ability (*). *Continuous variable.
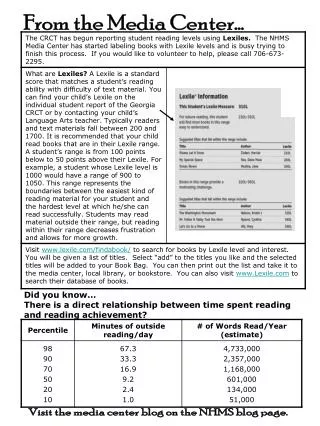
Characteristics of the Sample • The convenience sample consists of nine eight grade classes of three elementary schools on the territory of the city of Belgrade. • A total of 191 subjects were included in the sample. • In terms of sex distribution, the sample consists of 76 male and 104 female subjects(*).
Research Method This is a non-experimental field study.
Data Collection Techniques 4. Questions about reading for school. Two questions from Student Questionnaire for PISA 2009 (17 items). 5. An inventory designed for the purpose of this research. 1. Eight published PISA reading literacy units. Reading units formed a booklet of alternately arranged four units with linear and four units with nonlinear text format (a total of 18 items). 2.The S-1 and the IT-2 tests(part of KOG9 battery of aptitude tests). a) The S-1 test assesses spatial visualization and gives good measurements of the factor of eduction and the general cognitive factor; b) The IT-2 test is intended for the assessment of general visualization. 3. The RM-A test, which presents a shortened version of Raven's Progressive Matrices.
More about Data Collection I collected the data at the end of the first semester of the 2017/2018 school year. It took approximately 90 minutes, per class, to administer all instruments mentioned earlier. The research was anonymous.
Presentation of the Collected Data • I performed quantitative analyses of all the data using the IBM SPSS Statistics 21.0 software. • ANOVA and ANCOVA represent main data analysis procedures. • The framework for the presentation of the collected data are the earlier stated hypotheses.
H1 There is a positive association between visual-spatial ability and achievement on PISA reading literacy units.
Presentation of the Collected Data (H1) Table 1.Correlation matrix of dependent and independent variables. Table 2. Partial correlations of dependent and independent variables (the controlled variable is RM-A). ** p ˂ .01 ** p ˂ .01; *p ˂ .05
H2 Subjects with higher visual-spatial abilities score lower on PISA units with linear text format, than subjects with lower visual-spatial abilities.
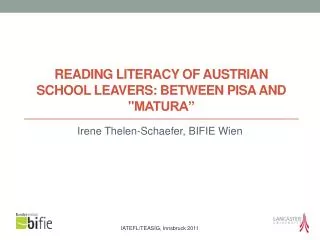
Presentation of the Collected Data (H2) After conducting an analysis of variance, by observing the relationship between S-1 test achievement and the achievement on PISA units with linear text format, there was a statistically significant association between groups, F(3,169)= 9.573, p ˂ .001. Graph 1. Relationship between S-1 test achievement and the achievement on PISA reading literacy units with linear text format. After introducing RM-A test achievement into the model as a covariate, the model remains statistically significant, F(3, 165) = 2.77, p ˂ .05. Graph 2. Relationship between S-1 test achievement and the achievement on PISA reading literacy units with linear text format, after controlling for the effect of RM-A test achievement.
Presentation of the Collected Data (H2) After conducting an analysis of variance, by observing the relationship between IT-2 test achievement and the achievement on PISA units with linear text format, there was a statistically significant association between groups, F(3, 169) = 7.094, p ˂ .001. Graph 3. Relationship between IT-2 test achievement and the achievement on PISA reading literacy units with linear text format. After introducing RM-A test achievement into the model as a covariate, the model didn`t remain statistically significant, F(3, 165) = 1.318, p ˃ .05.
H3 Subjects with higher visual-spatial abilities score higher on PISA units with nonlinear text format, than subjects with lower visual-spatial abilities.
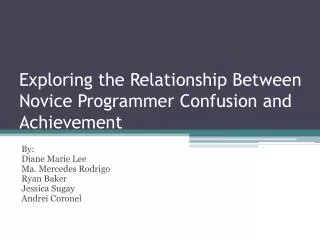
Presentation of the Collected Data (H3) Through an analysis of variance, I reached the finding that the groups formed based on S-1 test achievement, as a whole, are statistically significantly different when it comes to achievement in PISA units with nonlinear text format, F(3,165) = 10.467, p ˂ .001. Graph 4. Relationship between S-1 test achievement and the achievement on PISA reading literacy units with nonlinear text format. After introducing RM-A test achievement into the model as a covariate, the model remains statistically significant, F(3, 162) = 3.37, p ˂ .05. Graph 5. Relationship between S-1 test achievement and the achievement on PISA reading literacy units with nonlinear text format, after controlling for the effect of RM-A test achievement.
Presentation of the Collected Data (H3) Through an analysis of variance, I reached the finding that the groups formed based on IT-2 test achievement, as a whole, are statistically significantly different when it comes to achievement in PISA units with nonlinear text format, F(3, 165) = 7.388, p ˂ .001. Graph 6. Relationship between IT-2 test achievement and the achievement on PISA reading literacy units with nonlinear text format. After introducing RM-A test achievement into the model as a covariate, the model didn`t remain statistically significant, F(3, 162) = 1.337, p ˃ .05.
H4 Subjects with high visual-spatial abilities score higher on PISA units with nonlinear than on units with linear text format.
Presentation of the Collected Data (H4) • Students with the highest achievements on S-1 scored higher on nonlinear than on linear reading units, t(28) = 4.54, p ˂ .001. The same was true for students with the highest achievements on IT-2, t(33) = 3.44, p ˂ .01.
Additional findings In order to complement the presented findings, further analysis of students’ answers on each reading item was conducted.
Additional findingsAchievement on PISA items related to linear texts Table 3.Analysis of variance of achievement on individual PISA item related to linear texts (F ratio). Table 4.Analysis of covariance of achievement on individual PISA item related to linear text, after controlling for the effect of RM-A test achievement (F ratio).
Additional findingsAchievement on PISA items related to nonlinear texts Table 5. Analysis of variance of achievement on individual PISA item related to nonlinear texts (F ratio) Table 6.Analysis of covariance of achievement on individual PISA item related to nonlinear texts, after controlling for the effect of RM-A test achievement (F ratio).
Discussion and conclusion • There is a possibility that, with the booklet of PISA units, I was assessing the outcome rather than reading process, and that it could be the explanation of the difference between my earlier findings and presented findings. • To be continued!
Thank you for the attention! • Any questions? Suggestions?