Download
1 / 31
310 likes | 427 Views
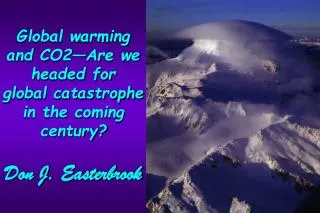
time. The 20 th century was a time of accelerating global change:. 4 “spikes” of global change. the human population spike the consumption spike the carbon dioxide/global temperature spike the extinction spike. Human Population clock. Animated map. Future Population Growth.

E N D
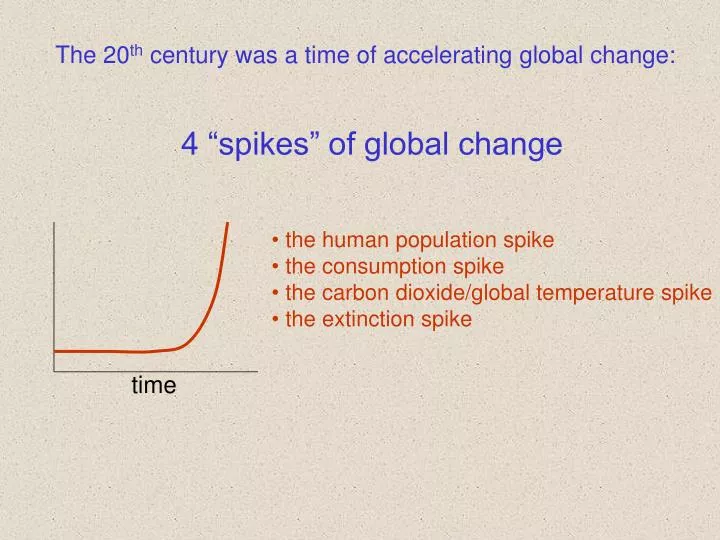
time The 20th century was a time of accelerating global change: 4 “spikes” of global change • the human population spike • the consumption spike • the carbon dioxide/global temperature spike • the extinction spike
Human Population clock Animated map
Per-capita consumption UNEP statistics
Increases in per-capita consumption is driven by developing countries
The “new consumers”: • New consumers are persons with purchasing power of at least $2,500 per year. • In 2000, the number of recently emerged “new consumers” was estimated at 1 billion. They join 850 million long-established consumers. • Most new consumers come from developing or transition countries. • (China, India, Indonesia, Brazil, Russia, Mexico, Philippines, Turkey, Thailand….) • Most significant environmental impact comes from: • diet shift towards meat (8 kg grain per 1 kg beef) • cars Myers and Kent, PNAS, 2003:
1.28 billion cattle occupy nearly 24 percent of earth’s landmass. They weight more than the entire human population. • Forest converted to pasture or production of cattle feed. • Desertification of marginal rangelands in semi-arid and arid regions. • Production of greenhouse gases (CO2, methane, nitrous oxide). • Decreased water quality through runoff from fertilized fields and feed lots. • Introduction of invasive species.
The carbon dioxide and associated temperature spike took off in the early 20th century
Extinctions The species extinction spike Number sof species eliminated world-wide per year Biologists surveyed by the Museum of Natural History (NY) say that current extinction rate exceeds last mass extinction event, when dinosaurs died. Global warming. World temperature highest in human history. Migratory animals begin to die off. Over 100,000 slash and burn fires set each year. Tropical forests lost at a rate of one football field per second. Three species extinctions per hour. Rapidly accelerating habitat destruction, connecting previously isolated ecosystems, allowing bioinvasions The Green Revolution kills off crop diversity and decimates wild pollinators and soil microbes. The Age of Exploration: millions of birds, seals and porpoises slaughtered by European hunters, hundreds of species lost. Half of forest cover destroyed after the Agricultural Revolution. “God’s Last Offer”, Ed Ayres, 1999
Cretaceous-Tertiary Date: About 65 million years agoDeath Toll: Up to 75% of marine genera; 18 percent of land vertebrates, & the dinosaurs What about mass extinctions?
Late TriassicDate: About 200 million years agoDeath Toll: 52% of marine generaPossible Causes: Severe volcanism; global warming Permian-TriassicDate: 286-248 million years ago; Death Toll: 84% of marine genera; 90-95% of marine species; 70% of land species.Possible Causes: Asteroid or comet impact; severe volcanism; dramatic fluctuations in climate or sea level The other major extinction events in earth history: Late DevonianDate: About 365 million years ago Death Toll: 55 percent of marine generaPossible Causes: Global cooling; loss of oxygen in oceans; impact Late OrdovicianDate: About 440-450 million years ago; Death Toll: 60 percent of marine generaPossible Cause: Dramatic fluctuations in sea level Late Pre-cambrianDate: About 650 million years ago; Death Toll: most unicellular organisms Possible Cause: O2 enrichment of atmosphere.
Just some of the hundreds of similar headlines: One Quarter Of All Mammal Species Face Extinction Soon (IUCN-- 2000) Monkeys, Apes Are Being Eaten to Extinction (Associated Press) Mass Extinction of Freshwater Creatures Forecast (WWF Report) 90% OF ALL LARGE FISH GONE FROM WORLD'S OCEANS (Nature-- 2003) North Sea Undergoing Ecological Meltdown (U.K. Independent) Amphibians Declining Worldwide (Boston Globe) Reptiles Vanishing Faster Than Amphibians (CNN) Migratory Birds and Animals Rapidly Dying Out (Environment News Service) Forests Face Global Extinction (United Nations) 1000's Of Medicinal Plants Being Harvested to Extinction (Australian Broadcasting Co.) 25% Of World's Conifers Threatened With Extinction (IUCN) One in Eight Birds Face Extinction (BirdLife International) 90 Percent of Great Ape Habitats Will Be Destroyed by 2030 (United Nations) …
The Pleistocene extinction (of the last ice age) was different from previous mass extinction events: • Selective disappearance of megafauna. • Occurred at different times on different land masses. • Previous ice ages did not result in similar extinctions.
Selective disappearance of megafauna: Species loss across America, Europe and Australia: 100% of herbivores > 1000 kg 75% of herbivores 100-1000 kg 41% of herbivores 5-100 kg < 2% of herbivores < 5kg
2. Occurred at different times on different land masses. Megafauna extinctions in % species lost The extinctions coincided with the arrival of human hunters and gatherers to continents... Except Africa!
Species numbers are declining on land and in aquatic systems World Wildflife Fund estimates
The current extinction rate is orders of magnitude higher than the long-term average extinction rate. Source Millenium Ecosystem Assessment
Total Number of threatened species by continent Source: EarthTrends 2007, using data from the IUCN Red List of Threatened Species 2007.
The cucumber tree, Yemen Kirtland's Warbler Anegada Ground Iguana, Virgin Islands Mountain Gorilla Central Africa Cycas transachana, Thailand Ambositra Palm Madagascar
The Atlantic Coastal Rainforest of Brazil (450 tree sp./ha. highest richness on earth)
1960: 50% left. 194585.4% of Bahia state was forest.
1990: 6% left. 1974: 25% left.
The multiple impacts of humans on biodiversity and ecosystems: • Overexploitation of game animals. • Purposeful setting of fire to manipulate the movement of game animals. • Clearing of natural ecosystems for agricultural production. • Introduction of non-native species. • Overfishing. • Pollution: new inputs into material cycles at a global scale (nitrogen, carbon dioxide, pesticides, …).
Spike 1 Human population size Diet and lifestyle changes of “new consumers” Spike 4 Spike 2 Loss of biodiversity Consumption Over-exploitation Pollution Habitat loss Fossil fuel burning, Slash & burn of old forest Fertilizer production Rapid climate changes Spike 3 CO2 and other greenhouse gases