STOPPED CR MUONS
410 likes | 548 Views
STOPPED CR MUONS. 18. AVGUST 2011. Stopped CR muons.

STOPPED CR MUONS
E N D
Presentation Transcript
STOPPED CR MUONS 18. AVGUST 2011
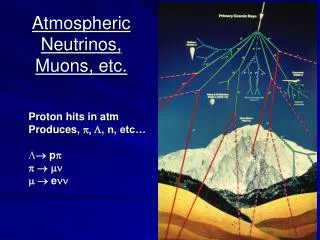
Stopped CR muons • There are many (>10!) student’s experiments for CR muon lifetime and flux determination from distributions of time intervals between successive background counts, (similar to what we presented in the Lab paper), with different detectors and electronics, but none with spectral analysis • (TEACHSPIN Muon Physics Apparatus 2009, Asmita Redij Tata Inst. INO Training School, Lawrence Wiencke Colorado School of Mines 2011, T.E.Coan Southern Methodist Univ 2005, Tycho Sleator New York University 2005, Michael Romalis Princeton University 1990-2008, Mark Pearce Kungl Tekniska Hogskolan Stocholm 2003, MIT Department of Physics 2010, R.A.Schumacher Carnegie Melon University 2010, Universidad Nacional de La Plata Departamento da Fisica) • What is our advantage of spectral information, if any?
Our distribution of (short) time intervals between successive counts in big plastics (Lab paper)
We have to separate the Start and Stop pulses, and find their spectra !
This is performed by the upgraded LBLDV (V092), which upon request exports the ndt file (sukc), for any ticked spectrum (single or coincident), containing the time intervals between the pulses (in the specified time interval dT) together with the amplitudes of the start and stop pulses Start Stop dT
This ndt file is imported into the LBLTT (V029) where the three spectra (the spectrum of time intervals between starts and stops, the spectrum of starts and the spectrum of stops) can be produced, viewed and exported, with arbitrary cuts imposed on any of the three spectra, e.g.: Time intervals
between these Starts and these Stops And as the free bonus Time Series can be obtained for any of these spectra !
To the cut marked I on the time spectrum there correspond the Starts and Stops spectra that contain both the spectra of through going muons and the stopped muons, while the cut II contains only the through going muons, since by then all the stopped muons have decayed
When the corresponding Starts and Stops spectra are exported from the LBLTT they can be imported either to ORIGIN or ROOT, where they can be presented and subtracted. E.g. when from the Starts spectrum corresponding to cut I the Starts spectrum corresponding to cut II is subtracted, the spectra of the through going muons will roughly cancel, and only the spectrum of stopped muons will remain. Same holds for the Stops spectrum, which after subtraction of Stops spectrum corresponding to cut II from that corresponding to cut I, contains only the spectrum of energy losses of electrons from muon decay
For instance, the Starts (red) and Stops (blue) spectra corresponding to cut I, the difference between them being due to the difference between the signatures of stopped muons (present in the Starts spectrum, and that of decay electrons (present in the Stops spectrum), on the SURFACE A
The Starts (red) and Stops (blue) spectra corresponding to cut II, where all the stopped muons have already decayed, and all the starts and stops are only the through going muons, which are all the same, and therefore the Starts and Stops spectra are identical. Again on the SURFACE B
Same as slide A, but in CAVERN. Mind the difference between A and C ! C
And now the results of subtracting the starts spectra for different time intervals, what is the pure spectrum of stopped muons, and the stops spectra for different time intervals, what is the energy loss spectrum of decay electrons (both at SURFACE)
Comparison of singles (through-going HE muons) (red), stopped muons (black circles) and decay electrons (white circles), at the SURFACE
Comparison of singles (through-going HE muons) (red), stopped muons (black circles) and decay electrons (white circles), in CAVERN
Comparison of singles (through-going HE muons) (red), stopped muons (black circles) and decay electrons (white circles), at the SURFACE and in CAVERN
Muon energy losses LO E mu HI E mu
Some comments • Energies of stopped muons peak above the energy losses of high-energy through-going muons (Singles), on SURFACE at about 15 MeV, and in CAVERN at somewhat over 20 MeV • Energy losses of decay electrons peak below the energy losses of through-going muons, at about 7 MeV, with the long low-intensity high-energy tail. On the SURFACE, there is a sharp low-energy peak at about 2.5 MeV, even below the cut in the Singles (cc d1d2) spectrum!? Also, the tail at SURFACE is of much lower intensity • This points to significant differences between the spectra of stopped (low-energy) muons at the surface and underground • Effects of stopped muon polarization on energy losses spectra of decay electrons (their angular distribution) might be important – polarization of CR muons might be measured?!?
cont’d • Spectra of stopped muons and decay electrons exhibit some rather well defined characteristic inflection points, marked green, in comparison slides. This suggests that differential spectra, with cuts positioned at these points (low, mid and high energies), might yield additional information
Cuts for differential distributions SURFACE Starts 1=Beg=channels 0-500 2=Mid=channels 500-1500 5=Tail=channels 1500-20000 Stops 1 = Beg = channels 0-250 2 = Mid = channels 250-500 3 = Tails = channels 500-20000 CAVERN Starts 1 = Beg=channels 0-750 2 = Mid=channels 750-2500 3 = Tail=channels 2500-20000 Stops 1 = Beg = channels 0-750 2 = Tail = channels 750-20000
Comments !? • At SURFACE Stops have most pronounced low-energy peak when triggered with low-energy starts • The Starts both at SURFACE and in CAVERN have some structure around the Singles peak, when triggered with higher Stops energies
Start Mid – Stop Tail Start Mid – Stop Beg
Comments? • As yet I don’t know what to make out of PART III !? • Low energy starts and high energy stops produce flat time distribution only at Surface!? • In Cavern the starts corresponding to different parts of the stop spectrum have similar time interval distributions, while at Surface they differ considerably!? • Some differential time distributions have negative slope!!!