Download
1 / 13
130 likes | 261 Views
Changes in Health Insurance Coverage 2000-2010. John Holahan Vicki Chen Alliance for Health Reform October 14, 2011. What happened to insurance coverage in 2010?.

E N D
Changes in Health Insurance Coverage2000-2010 John Holahan Vicki Chen Alliance for Health Reform October 14, 2011
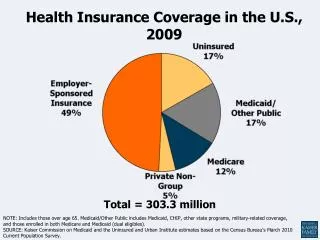
What happened to insurance coverage in 2010? In 2010, the uninsured increased by 800,000. The rate of employer-sponsored insurance declined in both adults and children by about 0.7 percentage points. Medicaid and CHIP coverage increased for children but not for adults The number of uninsured increased for adults but not children Young adults (19-25) saw significant increases in private coverage and their uninsured rate declined from 31.7% to 30.0%. Other age groups either had no change or had declines in private coverage and increases in their uninsured rates. This seems very likely to be the effect of the Affordable Care Act.
Percentage Point Changes in Health Insurance Coverage of Adults, Various Ages, All Incomes, 2009-2010 19-25 26-34 35-54 55-64 Change in Population 0.3 Million 0.1 Million 0.8 Million -1.5 Million Change in Uninsured -0.4 Million 0.3 Million 0.6 Million 0.4 Million *percentage point changes are significant at the .05 level
The 2000-2010 period began with a recession that was followed by declining unemployment and a modest recovery. The “Great Recession” began in 2007 and officially ended in June 2009. Changes in Unemployment Rates
Real incomes fell between 2000 and 2004, then grew slightly between 2004 and 2007. With the recession, real incomes again declined. Changes in Real Personal Incomes, 2000-2010
Virtually all the net change in population between 2000 and 2010 was among those with incomes below 200% FPL. Net Growth in Population Source: Urban Institute, 2011. Based on data from the 2001-2011 ASEC Supplement to the Current Population Surveys.
Change in Coverage Among Adults, 2000-2010 Among adults, employer sponsored insurance declined and the number of uninsured grew, even in the period of economic growth.
Change in Coverage Among Children, 2000-2010 The number of uninsured children actually fell over the decade; while employer coverage fell sharply, public coverage expanded.
Percentage Point Changes in Health Insurance Coverage of Adults and Children, All Incomes, 2007-2010 Adults Children Change in Population 3.9 Million 0.6 Million Change in Uninsured 6.3 Million -0.6 Million *percentage point changes are significant at the .05 level
Percentage Point Changes in Health Insurance Coverage, Low Income (<200%FPL) Adults and Children, 2007-2010 Adults Children Change in Population 10.1 Million 3.9 Million 5.6 Million -0.2 Million Change in Uninsured *percentage point changes are significant at the .05 level
Percentage Point Changes in Health Insurance Coverage, by Family Work Status, 2007-2010 Two Full Time Workers One Full Time Worker Part Time Workers No Workers Change in Population -7.2 Million -3.8 Million 6.2 Million 9.2 Million Change in Uninsured -0.4 Million 0.0 Million 2.4 Million 3.6 Million *percentage point changes are significant at the .05 level
Other Findings (2007-2010) Almost 60% of the increase in the number of uninsured was among whites, in line with their share of the population Almost 85% of the increase in the number of uninsured was among native citizens; non citizens were only a very small share of the growth The increase in the uninsured was distributed across all regions. The south continued to have the highest uninsured rate and had the largest increase in number of uninsured
Conclusions Long standing secular decline in ESI, exacerbated by economic downturns Slow increases of public coverage among adults, greater expansions for children; public coverage limited the increase in uninsured Increases in number of uninsured concentrated among adults, and among those losing full-time work Young adults seem to have benefited from the health reforms introduced in 2010, seeing gains in private coverage while other age groups saw declines Health reform will end link between ESI and uninsured by expanding Medicaid and providing tax credits in exchanges