Download
1 / 48
480 likes | 569 Views
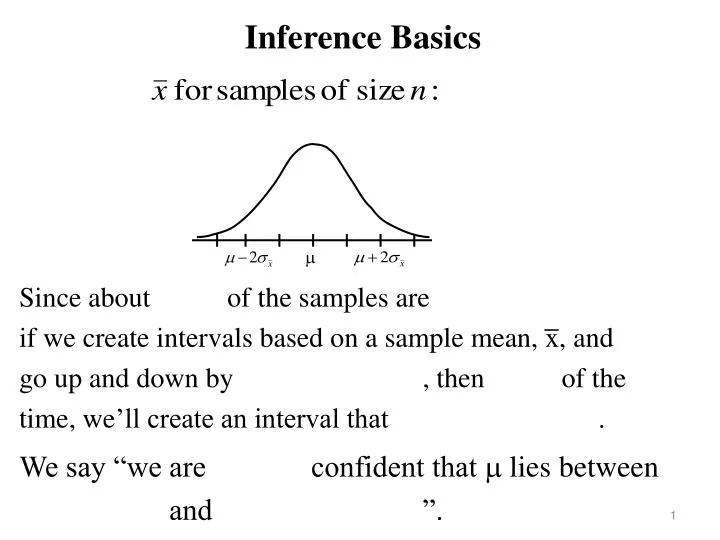
Inference Basics. Since about of the samples are if we create intervals based on a sample mean, x, and go up and down by , then of the time, we ’ll create an interval that . m.

E N D
Inference Basics • Since about of the samples are • if we create intervals based on a sample mean, x, and • go up and down by , then of the • time, we’ll create an interval that . m • We say “we are confident that m lies between • and ”.
Confidence Interval (CI) • Level of confidence: with repeated samples the probability the interval will contain the true parameter value. • Step 1: find an estimate for the parameter (the statistic) • Step 2: find the margin of error (creating a range of values) • Three conditions: SRS, Normal dist., and σ is known. • Estimate for mean: • Estimate for margin of error :
CI – on the calculator • Confidence Interval: • Estimate ± margin of error • Given data, need to enter: s, List location, C-Level • Given stats, need to enter: s, x, n, C-Level • On calculator: STAT, TESTS, 7:ZInterval • Select input (Data or Stats), enter appropriate info, then Calculate
Ex 1 . My jogging times for a 3 mile loop around campus has a known s = 2.7 min. In a random sample of 90 of these recorded times, the mean time was 22.6 minutes. Find a 95% C.I. for m. • Given stats, need to enter: s=2.7, x=22.6, n=90, C-Level=.95
Ex 2 . A certain breed of hummingbirds is being studied in southeast GA. A small group of 15 are tagged and weighed. Based on past studies, we assume weights are Normally distributed with s = 1.1 g. Find a 90% C.I. for m with Weights = 2, 2, 2, 2, 2, 2, 3, 3, 3.25, 3.5, 4, 4, 4.5, 5, 5 • Given data, need to enter: data in List, s=1.1, C-Level=.90
Ex 3 . The average high temperature in November in Savannah for the past 40 years averaged 71.16 degrees. Assume average high temperatures are Normally distributed with s = 3° F. Find 90% and 95 % CI. • Given stats, need to enter: s=3, x=71.16, n=40, C-Level=.90
Given stats, need to enter: s=3, x=71.16, n=40, C-Level=.95 Ex 3 – Continued – Find 90% and 95 % CI.
Ex 4 . A sample of 20 pumpkins averaged 9.2 pounds. Assume weights are Normally distributed with s = 1.5 lb. Find a 92% CI. • Given stats, need to enter: s=1.5, x=9.2, n=20, C-Level=.92
Significance Tests • Someone makes a claim that you do not believe. • So you look for evidence against the claim (supporting your belief). • If the claim were true, then how likely would it be to see a random sample behave the way it did? • Assume parameter (mean) is distributed Normally 0 2 3 -2 -3 -1 1
Significance Tests – Steps • State parameter being tested • State hypotheses: H0, the null hypothesis, usually no effect • Ha, the alternative, claim for which you are • trying to find evidence to support • Compute test statistic: if the null hypothesis is true, where • does the sample fall? Test stat = z-score • Compute p-value: what is the probability of seeing a test stat • as extreme (or more extreme) as that? • Conclusion: small p-values lead to strong evidence against H0.
Significance Tests – Hypotheses • H0, the null hypothesis, usually no effect. • Ha, the alternative, claim for which you are trying to find evidence to support. • Three kinds of alternatives:
Levels of Significance, α • α = .005 • α = .01 • α = .05 • α = .10 • Perform a significance test and get p-value of .037:
ST – on the calculator • On calculator: STAT, TESTS, 1:Z –Test • Given data, need to enter: m0, s, List location, Ha • Given stats, need to enter: m0, s, x, n, Ha • Select input (Data or Stats), enter appropriate info, then Calculate or Draw • Output: Test stat, p-value
Ex 5. Nationally, about 11% of the wheat crop is destroyed by hail. An insurance company investigates whether GA crops suffered damage different from the national average, N(11, 5). 16 GA claims of damage had a mean of 12.5% crop damage. 0 2 3 -2 -3 -1 1
Ex 6. A car manufacturer advertises a new car that gets 47 mpg. You suspect the manufacturer is exaggerating the mileage. A sample of 20 cars were tested and found to have a mean mpg of 45.2 miles per gallon. If s = 2.7, is there evidence at the 1% significance level that the manufacturer is overstating mpg? 0 2 3 -2 -3 -1 1
Ex 7. The mean running time for a certain type of battery has been 9.8 hours. The manufacturer has introduced a change in the production method and wants to perform a test to determine whether the mean running time has increased. Assume s = 2.1 hours and the sample mean of 40 batteries was 10.6 hours. 0 2 3 -2 -3 -1 1
Ex 8. A laboratory tested 12 chicken eggs from a local farm and found the mean amount of cholesterol was 230 mg. You believe this is significantly lower than the stated mean value for cholesterol in eggs, 240 mg, with s = 19.9 mg. Test your claim. data= 200, 200, 210, 220, 230, 235, 235, 240, 240, 245, 250, 255 0 2 3 -2 -3 -1 1
More with Inference • Three conditions: SRS, Normal dist., and σ is known. • Confidence Interval: • Estimate ± margin of error • Significance Test:
Changing margin of error • Margin of error = • Decrease margin of error by:
Deciding on sample size • If you want a margin of error at a certain level, m, • what sample size is needed for a given confidence level? • Margin of error =
Deciding on z* • If you want a given confidence level, how do you get z*? 0 2 3 -2 -3 -1 1 0 2 3 -2 -3 -1 1
Example • A 99% C.I. is [18.8, 48.0] for the mean duration of • imprisonment in months. • (a) What is the margin of error? • (b) What does that say about estimating mean duration? • (c) What minimum sample size is needed if you want a margin of error of at most 12 months (with 99% confidence and σ = 35 months)? • A sample size of is required.
Example-continued • (d) Create a 99% C.I. from a random sample of 57 prisoners. • Given stats, need to enter: • s = 35, x = 34.2, n = 57, C-Level=.99
Given stats: s=3, x=71.16, n=40, C-Level=.95 Ex 3 – Find 95 % CI for temperature. • What minimum sample size is needed if you want a margin of error of at most .75 degrees with 95% confidence? • A sample size of is required.
Error in Significance Tests • Type I: If we reject H0 when, in fact, H0 is true. • Type II: If we fail to reject H0, when, in fact, Ha is true. • Perform a test: H0: μ = 4; Ha: μ >4 • If evidence says to reject H0, and μ=4, then • If evidence says to reject H0, and μ>4, then • If evidence says to not reject H0, and μ=4, then • If evidence says to not reject H0, and μ>4, then
Ex 7 – The mean running time for a certain type of battery has been 9.8 hours. The manufacturer has introduced a change in production and wants to perform a test to determine whether the mean running time has increased. Assume s = 2.1 hours and the sample mean of 40 batteries was 10.6 hours. If, in fact, the mean running time is equal to 10.1, then your conclusion would be classified as a: Type I error Type II error correct decision
Ex 8 – A laboratory tested 12 chicken eggs from a local farm and found the mean amount of cholesterol was 230 mg. You believe this is significantly lower than the stated mean value for cholesterol in eggs, 240 mg, with s = 19.9 mg. Test your claim. If, in fact, the mean cholesterol level is equal to 240, then your conclusion would be classified as a: Type I error Type II error correct decision
Confidence Interval: • Estimate ± margin of error Inference for One Sample Mean • Significance Test: • State parameter being tested • State hypotheses • Compute test statistic • Compute p-value • Conclusion
Assumptions • Three conditions: SRS, Normal dist., and σ is known. • Now: • Which means is no longer used. • Instead of: • We’ll use:
Not quite Normal, still symmetric and bell-shaped, • gets closer to Normal curve as sample size increases t-distributions -3 -2 -1 0 1 2 3
Confidence Interval: • Estimate ± margin of error • On calculator: STAT, TESTS, 8:TInterval • Given data, need to enter: List location, C-Level • Given stats, need to enter: x, s, n, C-Level • Select input (Data or Stats), enter appropriate info, then Calculate
Ex 9. An adult patient has been treated for tetany, severe muscle spasms. This condition is associated with low levels of calcium, an average less than 6 mg/dl. Based on 10 recent calcium tests, find a 99.9% C.I. for m. 9.3 8.8 10.1 8.9 9.4 9.8 10.0 9.9 11.2 12.1
Ex 10. Drivers along a stretch of Abercorn were randomly selected to determine average speeds. In a sample of 23 cars, the mean speed was 49 mph and the standard deviation 4.25 mph. Find a 90% CI. • Given stats, need to enter: x=49, s = 4.25, n=23, C-Level=.90
Ex 11. A new process for creating artificial sapphires is being studied. From a random sample of 37 sapphires, the mean weight is found to be 6.75 carats with a standard deviation of .33 carats. Find a 99% CI. • Given stats, need to enter: x=6.75, s = .33, n=37, C-Level=.99
Significance Tests • On calculator: STAT, TESTS, 2:T –Test • Given data, need to enter: m0, List location, Ha • Given stats, need to enter: m0, x, s, n, Ha • Select input (Data or Stats), enter appropriate info, then Calculate or Draw • Output: Test stat, p-value
Ex 12. Do Honolulu residents have shorter lifespans than other Hawaiians? In a sample of 20 Honolulu residents, the mean lifespan was 71.4 years with a standard deviation of 15.62 years. The average Hawaiian lifespan is 77 years. Perform a significance test at the 5% level. 0 2 3 -2 -3 -1 1
Ex 13. Do drivers pay attention to the posted speed limits? In a sample of 23 cars, the mean speed was 49 mph and the standard deviation 4.25 mph. Is there evidence at the 10% significance level that drivers drive at something other than the posted speed limit of 50 mph? 0 2 3 -2 -3 -1 1
Ex 14. In producing artificial sapphires, you want to know if a new method makes something other than the industry’s average standard of 7 carat gems. From a random sample of 37 sapphires, the mean weight is found to be 6.75 carats with a standard deviation of .33 carats. Is there evidence at the a = .01 level? 0 2 3 -2 -3 -1 1
Ex 10&13 • stats: x=49, s = 4.25, n=23, C-Level=.90, a = .10 Compare C.I to two-tailed S.T. • Ex 11&14 • stats: x=6.75, s = .33, n=37, C-Level=.99, a = .01
Ex 15. Do educational toys make a difference? Using 6 pairs of identical twins to lessen any outside factors, one child is given educational toys and the other child is given non-educational toys. The difference in reading level is calculated for each pair. (age for exp. – age for con.)
Single Population Proportions • Asking about categorical variables • Questions like: Yes or No? Option 1, 2, or 3? • We want to make an inference for the proportion of a population that exhibit a certain characteristic. • p = • population proportion that has some characteristic • sample proportion that has the characteristic • An individual in a sample is a success if it has the quality.
Sampling distribution for samples of size n • from a population with p. • Mean: • Std. Deviation: • For large values of n:
Confidence Interval: • Estimate ± margin of error • This is best with large sized sample and at least 15 of • each, successes and failures. • On calculator: STAT, TESTS, A:1-PropInt… • Enter: x = number of successes • n = sample size • Confidence level
Significance Test: • On calculator: STAT, TESTS, 5:1 –PropZTest • need to enter: p0, x, n, Ha • Note: output gives z = (test stat) and p = (p-value)
Data Summary: Ex 16. Create a 96% C.I for estimating the proportion of all escaped convicts who will be eventually recaptured.
Deciding on sample size • If you want a margin of error at a certain level, m, • what sample size is needed for a given confidence level? • where p* is some guess for the sample proportion. • A value of p* = .5 is the most conservative (without any info on which to base a guess). • What sample size is needed in order to estimate the proportion of people voting for the Democratic candidate if the margin of error is to be no larger than 0.03 with a 99% confidence level?
Summary: Ex 17. Is new method of sight restoration better than an old one where only 30% of patients recover their sight? Test at the 1% significance level. p-value
Summary: Ex 18. Diltiazem causes headaches in 12% of hypertension patients. Will regular exercise reduce this side effect? Test at the 1% significance level. p-value