Download
1 / 24
250 likes | 488 Views
Methods of abundance estimation. Why count? Concern about conservation Lion / tiger Assessment of resource base Timber/ NTFP Assessment of threat to humans Blackbuck count- farmers Elephant count-villagers. Estimating population and its growth Estimate age – sex composition

E N D
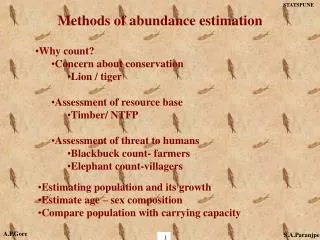
STATSPUNE Methods of abundance estimation • Why count? • Concern about conservation • Lion / tiger • Assessment of resource base • Timber/ NTFP • Assessment of threat to humans • Blackbuck count- farmers • Elephant count-villagers • Estimating population and its growth • Estimate age – sex composition • Compare population with carrying capacity A.P.Gore S.A.Paranjpe
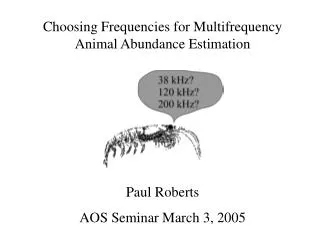
STATSPUNE • Standard methods • Capture- recapture • Nearest neighbor • Line transect • Non- standard methods • Waterhole census • Dung pile count • Bird count based on calls • Pugmarks method A.P.Gore S.A.Paranjpe
Estimation ofTiger Populationusing Pugmarks A.P.Gore S.A.Paranjpe
Pugmark - a single tiger paw print as a tracing / photograph taken from fixed height • Pugmark Track Set – • a series of paw prints from the same individual A.P.Gore S.A.Paranjpe
STATSPUNE Traditional method • Locate pugmarks • Trace them onto paper • Record time and place • Visual comparison • Eliminate repeats • What is left is the count • Criticism • No validation • No oscillation in count • Very low count of cubs • Subjective • Identifiability - questionable A.P.Gore S.A.Paranjpe
Pad 1. Area 2. Major axis 3. Minor axis Pug 4. Length 5. Width Distance 6. Toe 1 centre to Toe 2 centre 7. Toe 2 centre to Toe 3 centre 8. Toe 3 centre to Toe 4 centre 9. Pad centre to Toe 1 centre 10. Pad centre to Toe 2 centre 11. Pad centre to Toe 3 centre 12. Pad centre to Toe 4 centre STATSPUNE How to improve? Quantify shape and size A.P.Gore S.A.Paranjpe
Pick parameters - of distances between centres of pad & toes using the previously measured centre X/Y's A.P.Gore S.A.Paranjpe
STATSPUNE How to use measurements? • Establish objective criteria • Factors possibly affecting a pugmark print • Substrate • Operator • Sex of animal • Locality • Inter-individual variation • Intra-individual variation A.P.Gore S.A.Paranjpe
STATSPUNE Experiments • Substrate- same animal different substrates : Coimbatore • 3 substrates- fine soil, wet mud, sand • Two animals only • ANOVA for each variable • Most variables show no effect • Operators- same trail different operators: Melghat • Single trail • 6 operators • 3 prints each • ANOVA for each variable • Most varibles show no effect A.P.Gore S.A.Paranjpe
STATSPUNE • Sex- Pune, Coimbatore • 5 animals- 2 males, 3 females • Several prints on each (total 100) • Logistic regression : P= prob( a given animal is a female) • 3 measurements significant • Pad center- Toe 1 center distance(X1) • Pad center- Toe 2 center distance (X2) • Toe 1 center- Toe 4 center distance (X3) • Ln(p/(1-p)) =56.06 – 2.76X1 –3.56X2 –1.1X3 A.P.Gore S.A.Paranjpe
STATSPUNE Sex identification using logistic regression A.P.Gore S.A.Paranjpe
STATSPUNE Sex discrimination using Bhattacharya method • Mixture of normal distributions : to be separated • For a single normal distribution • Y = ln (f(x+)/ f(x)) = - [ 2 (x+ /2) - 2 ] / 2 2 • Slope of a line = - /2 intercept = / 2 • Mixture of distributions gives multiple falling lines • Plot y Vs x+ /2. Gives sequence of straight lines with • negative slope- each line one component A.P.Gore S.A.Paranjpe
STATSPUNE A.P.Gore S.A.Paranjpe
STATSPUNE • Bhattacharya method: • Male – squarish print • Female – rectangular • (Length – breadth) (of the covering frame) • Near 0 – male , > 0 female • Histogram of Breadth bimodal • Separate components by Bhattacharya method • Component with smaller mean breadth- females • With larger mean breadth – males Results: 1 = 10.26 , 2 = 12.75 estimated proportion of females= 40/75 0.53 Simplified rule adopted by foresters: (L-B) >2.5cm - female A.P.Gore S.A.Paranjpe
STATSPUNE • Locality - field data from project tiger: Melghat and Kanha • 90 prints each • Half data used for calibration • Discriminant analysis • Half data used for validation • Initially 10 variables used • Variables tested for redundancy • Two variables adequate • Toe1C- Toe2C distance • Toe1C- Toe3C distance A.P.Gore S.A.Paranjpe
STATSPUNE Classification of 90 tiger pugmark tracings from two populations A.P.Gore S.A.Paranjpe
STATSPUNE Does this help in estimating Tiger number? • No. • All analysis so far – macro level only • Key question- • How many distinct tigers in a set of n pugmark tracings? • An intuitive approach: • Compare known intra individual variation with • observed inter pugmark variation. • How to assess intra individual variation? • Analyze multiple tracings from the same trail. A.P.Gore S.A.Paranjpe
STATSPUNE An intuitive algorithm • X1, X2,…, Xn : n vectors ( n pugmarks) of order p • X i Follows normal distribution • with mean vectori • Var- cov matrix (assumed to be known) • Number of distinct tigers k (unknown) • Step 1 - H0 : k = 1 ( only one tiger) • Tn = sum[ (Xi –Xbar)’ -1 (Xi –Xbar)] • Reject H0 if T large .Then try k=2 A.P.Gore S.A.Paranjpe
STATSPUNE An intuitive algorithm(cont.) • H0 : k=2 • Omit one vector Xi which causes max reduction in Tn • Check if Tn-1(i) = sum[ (Xi –Xbar)’ -1 (Xi –Xbar)] is small • If yes, two tigers. Otherwise continue omitting. • Process terminates when homogeneous subgroups identified • Each subgroup – one tiger • confidence statement? • Not available in standard literature. • Recent algorithm developed by Chatterjee and Samanta(1999) • Not tested A.P.Gore S.A.Paranjpe
Foresters’ current approach Discriminant Analysis • Establish the parameters fit for consideration to facilitate individual identity • Multiple Group Discriminant Analysis done using SPSS Systat (unitwise) • Canonical Scores Plot from data generated by tracings/ digital photographs in SPSS Sigma ScanPro • Number of distinct pugmarks ascertained unitwise • If all tracks from each foot are grouped into 2 groups (eg. A & B) : then these sets are from 2 different tigers • Equal mixing (overlap) may indicate a single animal • 75% to 80% correct grouping is acceptable A.P.Gore S.A.Paranjpe
STATSPUNE Camera trap method • Major criticism about pugmark method • Identifiability • Alternative suggested : Camera trap • Tiger walks on footpaths • Two cameras placed on two sides of road opposite to each other • Activated as a laser beam is cut by any object • Tiger picture from both sides A.P.Gore S.A.Paranjpe
STATSPUNE • Claim : stripes on the back of tiger carry signature • Treat photograph as capturing and marking a tiger • Use capture-recapture model to estimate number • Objections: • Identifiability • Cost effetiveness • Feasibility • Proper sampling of forest • Controversy: which method is better • Camera trap or pugmark? A.P.Gore S.A.Paranjpe
STATSPUNE Comparison Camera trap Vs Pugmark • Identity • Based on picture based on pugmark • Ocular comparison numerical comparison • Intra individual variability • Not measurable measurable • Cost • Expensive inexpensive • Equipment intensive labor intensive • Suitability • Not suited for low density low density –no limitation • Unsuitable for rugged terrain unsuitable for swamps A.P.Gore S.A.Paranjpe
STATSPUNE Comparison Camera trap Vs Pugmark(cont.) • Sampling • Will see only a small fraction virtually every individual • seen. Can build a directory. • Individual life history can be • accumulated. • Territoriality is a problem no problem • Confidence interval • Can be given cannot be given A.P.Gore S.A.Paranjpe