Download
1 / 67
670 likes | 861 Views
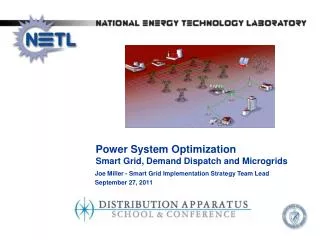
Power System Optimization Smart Grid, Demand Dispatch and Microgrids. Joe Miller - Smart Grid Implementation Strategy Team Lead September 27, 2011. This material is based upon work supported by the Department of Energy under Award Number DE-AC26-04NT41817

E N D
Power System Optimization Smart Grid, Demand Dispatch and Microgrids Joe Miller - Smart Grid Implementation Strategy Team Lead September 27, 2011
This material is based upon work supported by the Department of Energy under Award Number DE-AC26-04NT41817 This presentation was prepared as an account of work sponsored by an agency of the United States Government. Neither the United States Government nor any agency thereof, nor any of their employees, makes any warranty, express or implied, or assumes any legal liability or responsibility for the accuracy, completeness, or usefulness of any information, apparatus, product, or process disclosed, or represents that its use would not infringe privately owned rights. Reference herein to any specific commercial product, process, or service by trade name, trademark, manufacturer, or otherwise does not necessarily constitute or imply its endorsement, recommendation, or favoring by the United States Government or any agency thereof. The views and opinions of authors expressed herein do not necessarily state or reflect those of the United States Government or any agency thereof.
Initial Role – Modern Grid Strategy MGS Concepts form the foundation for the US Smart Grid vision 3 Mission – Accelerate grid modernization in the US Develop a vision for the Smart Grid Reach out to stakeholders to get input and consensus Assist in the identification and resolution issues Act as an “independent broker” Promote testing of integrated suites of technologies Communicate concepts to assist interested stakeholders Began in January 2005
New Role – Smart Grid Implementation Strategy Continue to act as an “independent broker” 4 Mission – To accelerate the transition to a smart grid through the development of implementation strategies and tools Create a national interest in “Performance Feedback” Develop Demand Dispatch concept Continue to communicate and educate stakeholders on fundamental SG concepts Provide technical support to industry groups as requested
Agenda Power System Optimization Today Value of “Advanced” Asset Optimization Role of the Smart Grid Demand Dispatch Microgrids Q&A
Agenda Power System Optimization Today Value of “Advanced” Asset Optimization Role of the Smart Grid Demand Dispatch Microgrids Q&A
What is Optimization? What other metrics are affected by grid optimization? General Definition • A broad set of interrelated decisions on obtaining, operating, and maintaining physical and human resources for electricity generation, transmission, and distribution that minimize the total cost of providing electric power to all classes of consumers, subject to engineering, market, and regulatory constraints
Is the System Optimized Today? Over 12M DG units on consumer premises representing 170 GW!
Utility Business Processes These processes are mature but limited in performance – the Smart Grid provides opportunities to optimize them further Planning – develop plans for new assets to support increased demand, improved reliability, and new interconnections, etc. Engineering – design, procure, construct facilities, modify and repair Operations – monitor conditions, assess impacts, operate reliably and efficiently, dispatch crews and manage switching operations, support repairs Maintenance - develop and implement programs to reduce corrective maintenance, perform preventive and predictive maintenance, and implement repairs Customer Service – process meter data into bills, manage revenue, interact with customers to address issues and educate
Where are we today? Utilities have made slow but steady progress in optimizing their assets Progress has been restrained by the limited availability of grid intelligence, granularity of control, and lack of integration of key processes Regulatory policy supports asset optimization (“Used and Useful”) Smart Grid technologies and applications create new opportunities for taking asset management to the next level Industry is moving forward with many asset optimization initiatives
Opportunity Exists for Improvement Smart Grid Maturity Model Source: Carnegie Mellon University (2009)
Agenda Power System Optimization Today Value of “Advanced” Asset Optimization Role of the Smart Grid Demand Dispatch Microgrids Q&A
Optimization Metrics Technology-enabled processes drive power system optimization Power System Optimization is aimed at improvements in more areas than cost: Reliability Efficiency Economics Environmental Friendliness Security
Optimization Value Areas • Reliability — by reducing the cost of interruptions and power quality disturbances and reducing the probability and consequences of widespread blackouts. • Economics — by keeping downward prices on electricity prices, reducing the amount paid by consumers as compared to the “business as usual” (BAU) grid, creating new jobs and stimulating the U.S. GDP. • Efficiency — by reducing the cost to produce, deliver, and consume electricity. • Environmental — by reducing emissions when compared to BAU by enabling a larger penetration of renewables and improving efficiency of generation, delivery, and consumption. • Security — by reducing dependence on imported energy as well as the probability and consequences of manmade attacks and natural disasters.
Optimization Creates Societal Value Hard to quantify but potentially a tipping point? Societal Benefits • Reduced losses from outages and PQ • Increased grid efficiency • Downward pressure on electricity prices • Economic growth and opportunity • Improved environmental conditions • Improved national security
Opportunities in Reliability Reduced losses from power outages and power quality issues • Reducing the probability of regional blackouts can prevent significant losses to society. The societal cost of the August 2003 blackout was $8.6 billion. • Reducing by even 20% the cost of outages and power quality issues, which are estimated to be at least $100 billion annually, would save $20 billion per year.
Opportunities in Efficiency Increased Grid Efficiency • Reducing T&D Losses, estimated at over $25 billion per year, by even 10% would save $2.5 billion/year. • Reducing transmission congestion costs, which range from $4.8 billion to as much as $50 billion annually, by 10%, could save up to $2 billion/year. • Effective integration of electric vehicles can greatly improve the efficiency of grid operations
Economic Opportunities Downward pressure on electricity prices • Eliminating or deferring large capital investments in generating plants, substations, and transmission and distribution lines, could reduce overall costs $46–$117 billion dollars over a 20-year period according to a 2003 PNNL report. • Reducing O&M spending by 10% as a result of Smart Grid operational savings would save up to $4 billion annually.
More Economic Opportunities Economic Growth • Creation of new jobs — up to 280,000 to create a Smart Grid alone. • Demand for new products and services created by Smart Grid related opportunities. • Creation of new electricity markets enabling society to offer its electricity resources to the market (DR, DG, storage). • Improved conditions for economic development — economic development depends on a reliable source of electric power. • Reduced wholesale electricity prices compared with BAU – This reduction will be achieved through a reduction in peak loads and energy conservation.
Environmental Opportunities • Reduction in total emissions — Through conservation, demand response, and reduced T&D losses, the total U.S. electricity consumption could be reduced by 56 to 203 billion KWh’s by 2030 (1.2–4.3%). • Per PNNL, Smart Grid could reduce carbon emissions by 15% by 2030 (442 million metric tons). • Deep penetration of electric vehicles – Smart Grid enabled – could reduce CO2 emissions an additional 3% by 2030 (83 million metric tons). • Improved public health — The impact of vehicle particulate emissions in urban areas can be reduced as the number of miles driven by CVs is offset by miles driven by electric vehicles.
National Security Opportunities • Reducing the U.S. dependence on foreign oil through the use of PHEVs could be up to 52% based on a recent PNNL report. This is an equivalent of reducing U.S. oil consumption by 6.5 million barrels per day. According to ORNL, the value of reducing this dependence is $13.58 (2004 dollars) for every barrel of oil import reduced, creating a potential opportunity of over $30 billion/year. • Reducing the probability (and consequences) of widespread and long-term outages due to terrorist activity could prevent significant societal costs that are immeasurable. (Grid robustness)
Agenda Power System Optimization Today Value of “Advanced” Asset Optimization Role of the Smart Grid Demand Dispatch Microgrids Q&A
What are the Characteristics of the SG? Enable active participation by consumers Accommodate all generation and storage options Enable new products, services, and markets Provide power quality for the digital economy Optimize asset utilization and operate efficiently Anticipate & respond to system disturbances (self-heals) Operate resiliently against attack and natural disaster
What’s different with the Smart Grid? ...for all Stakeholders Integration......Integration.......Integration! • De-centralized supply and control • Two-way power flow • Two-way information flow Creating the intelligence and capability to optimize: • Reliability • Security • Economics • Efficiency • Environment • Safety
How will the SG improve Asset Optimization? Process Reengineering and integration is a needed prerequisite • Deployment of integrated technologies • Integrated communications • Sensors and measuring devices • New advanced components • Advanced control methods • Improved interfaces and decision support tools • Implementation of new applications • Advanced Metering Infrastructure (AMI) • Consumer systems • Distribution Management System (DMS) • Information and Communicating technologies (ICT) • Demand response • DG and Storage operation and microgrids • RTO / ISO process integration
Planning Process Limitations Lack of complete time-stamped load data impacts accuracy of load forecasting and often results in early builds of new capacity (AMI, Smart Meters) Increasing growth of peak loads requires a continuous build-out of peaking units and new capacity projects that are greatly under-utilized (Demand Resources, DR) Planning tools are not integrated resulting in sub-optimization at the enterprise level (Advanced Analytics) System data regarding actual system responses to faults (e.g., fuses, reclosers, breakers) may be lacking, hampering the ability to verify the effectiveness of past coordination studies (IED’s)
Engineering Process Limitations A single, common engineering model of the electric system is often not integrated and is sometimes incomplete (AM/FM, GIS, DMS) The integration of design processes, technologies, records, and data is often incomplete and not shared with all departments that could benefit. (Process Reengineering, SOA) The ability of all authorized users to access engineering drawings, maintenance records, and other pertinent data is not fully automated. (MWFM, SOA) Limited operational data are available to engineers that could help them improve future designs. (DMS) The Design/Build process is often not integrated with the work and resource management processes. (AM/FM, GIS, MWFM)
Operational Limitations Distribution operations often lack key operational data needed for situational awareness, problem diagnosis, and forecasting (Advanced sensors, DMS) Operational processes and technologies often lack integration with other dependent processes (OMS, weather, crew status and location, engineering records, customer service , etc.) (DMS, MWFM) Operational processes have not yet advanced to the level needed to support the integrated operation of distributed resources (Advanced Control Methods, DMS, CVR) Operators are often unaware of the health of system assets because that information is often not readily available (Advanced Sensors, CBM)
Maintenance Process Limitations Automation of data collection processes for maintenance inspections is limited and not integrated with engineering and operations processes (MWFM, DMS, AM/FM, GIS) Deployment of asset health monitoring devices and associated communication systems is limited. (Advanced sensors, CBM) Integration of asset health intelligence with operational decisions is limited (knowledge of assets in “stress”) (CBM, DMS) Power quality diagnoses are difficult and time consuming since the installation of temporary instrumentation to trend suspected parameters is often necessary (AMI, Advanced sensors) Online access to maintenance records and engineering documents is limited (SOA, AM/FM)
Customer Service Process Limitations Customer service representatives (CSRs) are limited in responding to customer questions because data sometimes is derived or comes from the operations or engineering processes (AMI, DMS, SOA) “Turn-on and turn-off” requests require a truck roll, labor costs, and delays in satisfying customer requests (AMI) Call centers are managed to keep customer wait times to a minimum. Lack of operational information slows down CSRs and can reduce their success rates at satisfying customers (OMS, DMS, AMI, SOA)
Smart Grid Milestones • Consumer Enablement • Advanced Distribution Operations • Advanced Transmission Operations • Advanced Asset Management • The first three milestones enable Advanced Asset Management
Consumer Enablement Advanced Distribution Advanced Transmission Advanced Asset Management Sequence can vary CE empowers the customer and enables grid interaction AD improves reliability and enables self healing AT addresses congestion and integrates with RTO’s • AAM helps utilities reduce costs and operate more efficiently 33
Consumer Enablement Solutions CE empowers the customer and supports grid optimization Smart Meters & 2–way communications Consumer Portal / Home area network Meter Data Management Time of Use Rates Customer Information System IT upgrades (SOA) Customer Education Demand Response and DER
Advanced Distribution Solutions • Smart sensors and control devices • Distribution Management System • Advanced Outage Management • Distribution Automation • Geographic Information System (GIS) • DER and Micro-grid operations • Advanced protection and control Advanced Distribution improves efficiency and enables “Self Healing” and the use of Demand Resources 35
Advanced Transmission Solutions • Substation Automation • Advanced regional operating applications (RTO) • Wide Area Measurement System (WAMS) • Advance materials and power electronics • Hi-speed information processing • Modeling, simulation and visualization tools • Advanced digital protection Integrated with CE and AD—AT provides new options for transmission operations 36
Advanced Asset Management Solutions • Advanced sensors • System Parameters • Asset “health” • Integration of grid intelligence with other processes: • Operations to optimize asset utilization • T&D planning • Condition based maintenance • Engineering, design and construction • Work and resource management • Customer service AAM will enable grid optimization to “move to the next level” 37
DMS – A Platform for Optimization The great value of DMS is its capability to display multiple overlays to give users a complete context of various parameters that have been historically separated by utility department processes and technologies (silos). Common enterprise network electrical connectivity model Geographic information system (GIS) Supervisory control and data acquisition (SCADA) Customer Information System (CIS) Engineering Information System (EIS) Advanced Metering Infrastructure (AMI) Outage management system (OMS) Distribution automation (DA) Conservation Voltage Reduction (CVR) Condition-based maintenance and asset health monitoring Workforce Management System Distribution planning tools Advanced Network Applications
New Markets Drive System Optimization The Smart Grid is expected to create many new markets Aggregators Energy Service Providers Financial Systems (PEV transactions) PEV’s (kwh fuel, V2G, charging stations) Smart Appliances In-home Networks Home Energy Management Systems Others not yet known
Agenda Power System Optimization Today Value of “Advanced” Asset Optimization Role of the Smart Grid Demand Dispatch Microgrids Q&A
Demand Response is not Demand Dispatch Source: Energy Central Webcast 4/7/11
Demand Dispatch Definition Demand Dispatch may be the “killer application” that integrates many of the Smart Grid, DR, and Energy Efficiency capabilities “An operating model used by grid operators to dispatch “behind-the-meter” resources in both directions—increasing and decreasing load as viewed at the system level—as a complement to supply (generation) dispatch to more effectively optimize grid operations.” NETL Smart Grid Implementation Team
Two Categories of Resources • Supply Resources are located on the utility side of the point of delivery (meter) • Central generation • Peakers • Wind and solar farms • Utility scale storage • Used by supply dispatch • Demand Resources are located behind the point of delivery • Variable load • Local generation and storage (wind, solar, EV’s) • Used by demand dispatch
Demand Resources Are there enough to make DD work?
Dispatch Spectrum Supply / Demand Mismatch DD Operates Here RTO / Transmission LDO / Distribution Supply Dispatch Demand Dispatch Supply Dispatch Demand (operating model) Load Commitment Unit Commitment Demand Resources Adj. Load Profile Variable Load DG Storage Supply Resources IOU IPP Ancillary Services Reserves Regulation Reserves Regulation DR Operates Here
Consumer Benefits of Demand Dispatch • Financial savings on the retail “power bill” received from the “utility” from reduced energy consumption and reduced demand (for customers who have a demand charge.) Anytime the consumer uses less kWh their energy bill will be lower. Anytime the consumer keeps his demand below the “penalty level” it will avoid the demand charge. This is a savings from the retail slide. • Revenue earned from market participation in the wholesale market through interface with an aggregator, who provides the market interface between the consumer and the wholesale RTO. This revenue can come from the energy, capacity, and ancillary services markets. This is revenue earned by the consumer from the wholesale market via the aggregator. • Identification of new and permanent energy efficiency solutions that become obvious as variable loads are replaced with more efficient solutions (e.g., rather than modulate the ballasts of lighting from 100 watts to 80 watts as part of Demand Dispatch, just replace the lighting with more efficient, lower wattage lighting.)
Societal Benefits of Demand Dispatch • Incremental downward pressure on future prices over BAU —Large capital investments in additional supply resources can be eliminated or deferred, reducing future retail prices to consumers over what they would have been if these investments would have been made. • Reduction in real time wholesale prices — By reducing the peak in the real time market, a less costly unit will clear the market, reducing real time wholesale prices. All consumers benefit even though only a small percentage participate in the DD transactions that actually cause the wholesale clearing price to be less. • Ability to increase the future integration level of renewables — DD will enable an incremental increase in the amount of variable (renewables) supply resources that can be accommodated into grid operations. This incremental amount of renewables has a corresponding future value in reduced emissions of all types. • Increased use of existing renewable resources — DD will enable a higher level of optimization of supply resources to occur in the real time “environmental market” (future carbon or emissions markets). This optimization can be done around minimizing emissions. This is a real time benefit in reducing emissions of all types.