Download

1 / 20
200 likes | 312 Views
Cluster analysis of mean sea level pressure fields and multidecadal variability. David Fereday, Jeff Knight, Adam Scaife, Chris Folland, Andreas Philipp 13 March 2007. Introduction. Use cluster analysis to examine circulation variability Are genuine clusters present in MSLP data?

E N D
Cluster analysis of mean sea level pressure fields and multidecadal variability David Fereday, Jeff Knight, Adam Scaife, Chris Folland, Andreas Philipp 13 March 2007
Introduction • Use cluster analysis to examine circulation variability • Are genuine clusters present in MSLP data? • Stability of different numbers of clusters • Multidecadal variability and links with SST
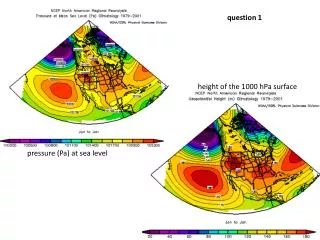
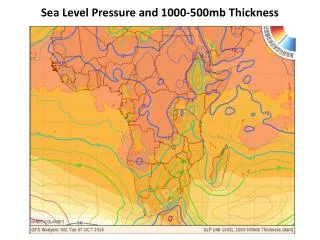
Data • EMSLP dataset – daily mean MSLP fields 1850-2003 • NAE region – 25°N-70°N, 70°W-50°E • 5 degree x 5 degree resolution
Methods • Divide data into two month seasons • Seasonally varying climatology removed • Apply cluster analysis to fields in each season separately • Aim is to characterise daily variability – no low pass filtering applied
Cluster algorithm • Variant of k-means • Specify number of clusters beforehand • Each field belongs to one cluster • Random initial allocation • Minimise within cluster variance by exchanging fields
Simulatedannealing k-means Global minimum Local minimum Simulated annealing Total Variance • Aim to avoid local minima Alternative clusters
Are there clusters in MSLP fields? • Algorithm produces clusters whether any present or not • If clusters are present, there must be a fixed number of them • Number of clusters is specified beforehand – how is this number decided?
Local minima Global minimum Local minima • Try to find local minima of total within cluster variance • For all but small numbers of clusters, many different alternatives
Cluster stability • Best estimate of global minimum variance • Clusters stable to removal of data?
Form clusters Go back to full data set Remove half of the data Form clusters Pair up clusters with originals Start with full set of data Cluster stability method - schematic Count the days that match up
Stability measure • Repeat analysis 100 times • Ratio of days that match to total days • Stability change with number of clusters • Optimum number?
JF cluster stability • JF 1900-1949 (blue) 1950-1999 (red)
Cluster conclusions • Many local minima - no strong clustering • Stability reduced as clusters increase • No optimum number of clusters • Choice of number of clusters is subjective • Clusters are nevertheless useful!
Multidecadal variability • 10 clusters per season • Circulation variability - frequency time series • Variability on many different timescales • Low pass filter (25 year half power) • SST links via regression analysis • HadISST from month before MSLP season
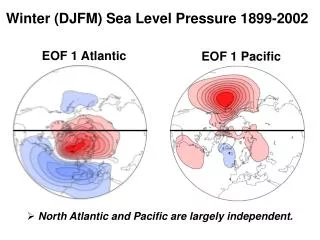
Positive summer NAO Negative summer NAO July / August – summer NAO / AMO links
Conclusions • No genuine clusters, but clusters still useful • Clusters relate to EOF time series • Reproduce known relationships with SST • Many results – hint at new SST links