Download
1 / 14
140 likes | 324 Views
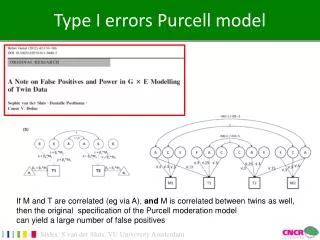
AP Statistics. Calculation and Behavior of Type I and Type II Errors. Mr. Killian February, 2005. Definitions of Error Types. Type I error – Concluding that the null Hypothesis ( H o ) is false when in reality it is true. Probability of Type I error =

E N D
AP Statistics Calculation and Behavior of Type I and Type II Errors Mr. Killian February, 2005
Definitions of Error Types • Type I error – Concluding that the null Hypothesis (Ho) is false when in reality it is true. Probability of Type I error = • Type II error – Concluding that the null hypothesis is true when in reality it is false. Probability of Type II error = • Power = 1 - : The probability of correctly concluding that the null hypothesis is false
Calculating Type II Error Probability • To calculate the probability of a Type II Error, two things are needed • A hypothesis test, with specified Ho, Ha, , n, o, and • A specific alternative value of the population mean, a
Sampling Distribution if Ho is true Ho: = o Ha: >o Sig. Lev. Rejection Region Acceptance Region o Steps to Calculating 1. Set up Hypothesis Test to define Rejection Region and Acceptance Region
Sampling Distribution if Ho is true Rejection Region Acceptance Region o Sampling Distribution if = a a Steps to Calculating 2. Draw the sampling distribution for = a
Sampling Distribution if Ho is true Rejection Region Acceptance Region o Sampling Distribution if = a a Steps to Calculating 3. The area of the distribution with = athat overlaps with the acceptance region is
Example • Mr. Postman Makes a Strict Budget of $400 for his Gas Bill. He is concerned that his budgeting is off and that this will damage his finances: • Ho: = $400 • Ha: >$400 • = $50 • n = 24 • = 0.1 • Find when = $425.
Calculations • Standard deviation of sampling distribution • z-score for rejection region • = 0.1, 1-tail: z* = 1.28 • Value of sample mean to reject • . • Reject for sample mean > $413.1
Example: Calculating Sampling Distribution if Ho is true o=$400 Sampling Distribution if = $425 • =normalcdf(-1E99, 413.1, 425, 10.2) =0.1217 a=$425
o=$400 What happens if? is reduced while parameters and n stay the same o= $400 a=$425 a=$425 BEFORE: = 0.1 AFTER : = 0.02 increases and Power decreases
What happens if? a moves further from o while everything else is unchanged o=$400 o=$400 a=$425 a=$450 BEFORE: a=$425 AFTER: a=$450 decreases and Power increases
What happens if? n increases while all parameters are unchanged o=$400 o=$400 a=$425 a=$425 BEFORE: n = 24 AFTER: n = 48 and decrease and Power increases
Summary • A Type II error means that the null hypothesis is accepted when it is false • Calculation of a Type II error depends on a specific, given alternative value of the population mean: = a • and demonstrate the following behavior: • If is lowered, increases (and power decreases) • If is raised, decreases (and power increases) • If a is changed to a value further from o, then decreases (and power increases), and vice versa • If n increases and decrease (and power increases), and vice versa