Sapphire Half-wave Plate Characterization
10 likes | 211 Views
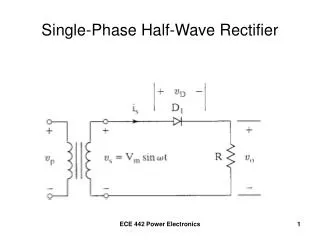
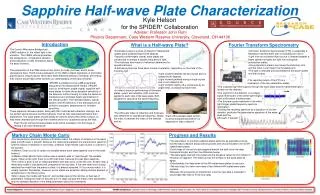
Sapphire Half-wave Plate Characterization. Kyle Helson for the SPIDER* Collaboration. Adviser: Professor John Ruhl Physics Department, Case Western Reserve University, Cleveland, OH 44106. I ntroduction. What is a Half-wave Plate?. Fourier Transform Spectrometry.

Sapphire Half-wave Plate Characterization
E N D
Presentation Transcript
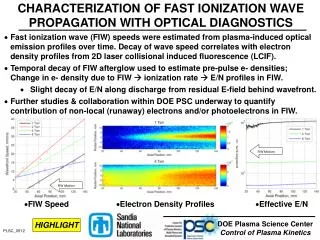
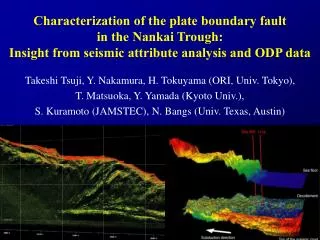
Sapphire Half-wave Plate Characterization Kyle Helson for the SPIDER* Collaboration Adviser: Professor John Ruhl Physics Department, Case Western Reserve University, Cleveland, OH 44106 Introduction What is a Half-wave Plate? Fourier Transform Spectrometry The Cosmic Microwave Background (CMB) radiation is the oldest light in the universe. The CMB’s various properties, like temperature, temperature variation, and polarization, reveal information about the early Universe. • A half-wave plate is a piece of dielectric material that • rotates plane polarized light by 90 degrees. • Typically a birefringent crystal, wave plates areconstructed to operate a specific frequency of light. • The thickness and indices of refraction determine the operational band. • A Fourier Transform Spectrometer (FTS) is essentially a Michelson interferometer with a moveable arm mirror. • Light from an incoherent light source is directed towards a beam splitter that splits the light into orthogonal polarization states. • One polarization state is sent down the stationary arm and the other is sent down the moveable arm. • The light is reflected and recombined at the beam splitter and then output. • http://en.wikipedia.org/wiki/Wave_plate http://map.gsfc.nasa.gov/media/030653/index.html http://en.wikipedia.org/wiki/Michelson_interferometer • A half-wave plate has three basic modes of operation, depending on the state of the incoming light : • Light incident between the two crystal axes is rotated by 90 degrees. • Light incident perfectly along a single crystal axis is not rotated at all • Light incident slightly off a crystal axis by an angle theta, is rotated by twice theta. The polarization of the CMB comes in two forms, E-mode (curl-free) and B-mode (divergence free). The B-mode polarization of the CMB contains signatures of primordial gravity waves. Gravity waves have never been detected directly or indirectly, and finding their imprint would help further cement our understanding of the early Universe. • The resulting output of the FTS is a modulation of the two polarization states. SPIDER is a balloon-borne CMB polarimeter designed to find these faint B-modes. SPIDER uses six birefringent, single-crystal, sapphire half-wave plates to rotate the polarization sensitivity of the detectors without having to rotate the detectors themselves and eliminate beam asymmetries in the optical system. The half-wave plates, optical system, and the detectors in the telescope are all cooled to cryogenic temperatures to increase sensitivity. • The outputted light then passes through the wave plate and the transmitted light is incident on the detector. Red represents incident light, Blue represents transmitted • In order to improve performance of the wave plates, quartz anti-reflection (AR) coats are applied to each side of the wave plate. Both designed to operate at the same frequency. • The AR coats’ index of refraction and thickness also determine its operational frequency. Ideally the index is between the index of the material and air. • The signal from the detector is a voltage signal reminiscent of the white-light fringes from a Michelson Interferometer. • The discrete cosine transform of the white-light fringes yields frequency spectrum information. http://map.gsfc.nasa.gov/resources/imagetopics.html • Dividing the resulting spectrum by a spectrum of just the detector, produces the transmission spectrum of the wave plate and theAR coats, if present. These sapphire half-wave plates, along with their matched anti-reflection coatings, are not perfect optical devices and their behavior must be fully characterized before their deployment. The wave plates should ideally be uniform across their whole surface, so they were characterized through their centers and in four quadrants across the face. • Each AR coat/wave plate system must be characterized before it is deployed for data collection. Even though testing the wave plates at 4K will be necessary, this first stage of testing is at room temperature. Markov Chain Monte Carlo Progress and Results • The transmission spectrum contains information about the indices of refraction of the wave plate and AR coats, if present. Because the relationship between the transmission spectrum and the indices of refraction is non-linear, a Markov Chain Monte Carlo routine is used to fit the spectra. • A Markov Chain is a list of states of a variable where each state depends only on the state before it. • A Markov Chain Monte Carlo routine uses a random walk to “step though” the variable space. (Seen at the right, there is no AR coat chain, because this was bare sapphire). • The routine is given a set of initial parameters and step sizes, set by the user. At each step, a theoretical model is calculated and compared to the real data. If the new state more closely matches the model than the previous state, it is always accepted, if it is a worse match, it is usually rejected. Sometimes, however, worse states are accepted, adding another element of randomness to the fitting routine. • After n steps, the routine will “burn-in” and oscillate around the minima, or best set of parameters. Taking the mean of the post-burn-in steps will give the mean of the parameters and the standard deviation of the fitted parameters gives the uncertainty. • The data taken on the bare sapphire plates performs as expected, proving that the data collection and processing works and should be able to fit the AR-coated wave plates. • Color maps of one set of plain sapphire data-to the right-show the data, theoretical model, and then the difference below. • The data agree well with the model and the literature values for the indices of refraction of sapphire. The scans across the surface of the wave plate all agree. • Unfortunately, the data taken of the AR coated wave plates is very poor. • The next step is to take more data of two different AR coated wave plate systems. • Because the processing is streamlined, once the new data is collected, it should take less time to fit the new data. Acknowledgements: Richard Bihary, Sean Bryan and Tom Montroy, Physics Department, Case Western Reserve University *SPIDER Collaboration: California Institute of Technology, Cardiff University, Imperial College of London, JPL, Kavli Institute for Cosmology-University of Cambridge, NIST, Princeton University, Stanford University, University of Toronto, University of British Columbia.