Download
1 / 39
390 likes | 562 Views
How Social Network Analysis can help to measure cohesion in collaborative distance-learning. Christophe REFFAY Thierry CHANIER Laboratoire d’Informatique de Franche-Comté Besançon - France. Outline. Introduction Experiment : Simuligne learning session SNA computational models Cliques

E N D
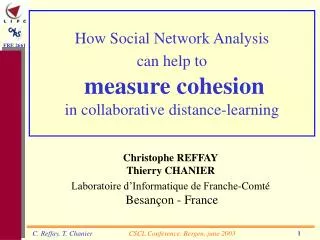
How Social Network Analysis can help tomeasure cohesionin collaborative distance-learning Christophe REFFAYThierry CHANIER Laboratoire d’Informatique de Franche-ComtéBesançon - France
Outline • Introduction • Experiment : Simuligne learning session • SNA computational models • Cliques • Clusters • Conclusion
The problem • Face-to-face: • Visual & Oral indices Distance: Interaction data
Hypothesis CL works well in « Active » groups. Collaboration requires communication Questions synthesis from communication data appropriateness importance computability Representation Our approach:
How SNA can help ? Social Network Analysis, based on: • Group dynamics • Social relationships models • Graph theory
The central role of "Cohesion" • Necessary for collaborative tasks • Very important for social aspects • Essential for motivation (no isolation)
Cohesion ? much more complex than… temperature, speed, or weight… …Less physical, and more human ! Cohesion is an attractive "force" between individuals
Cohesive subgroups SNA (Wasserman & Faust, 1994) : "Subsets of actors among whom there are relatively strong, direct, intense, frequent or positive ties"
Research Ministry of France Programme COGNITIQUE 2000 (53 K€) ICOGAD Project Analysis of interaction tracks from SimuLigne Definition of needed indicators to follow a group Development of new tools to plug in LMS partner partner leader Research context : the ICOGAD project Simuligne : The training session Simuligne : The training session
Pedagogical hypothesis To produce together Learning
The learning context • 100% at a distance • French as foreign language • Public : 40 adults • English speakers • Advanced level in French • Web litterate • Groups of 10 + tutor + 2 NS • LMS : WebCT • 30 hours over 10 weeks
Tutor Tutor Tutor Tutor Learners Learners Learners Learners The Simuligne organisation Coordinator Aquitania Gallia Lugdunensis Narbonensis
Simuligne Interaction data • e-mail : 834753 chars in 4062 messages • Forum : 879015 chars in 2686 messages • Chat : 234694 char. in 5680 speach turns
Communication graphs • Only read (opened) messages. • (separately) on E-mail or Forum • for a given period • Gives the number of messages sent by A and read by B on the directed edge A->B
The E-mail Graph matrix For Gallia over the whole training period
A forum graph (Gallia) … Not very useful information
Forum Matrix Not straightforward to use...
Our first try… Global index of cohesion (Group) • 0 for no relation • Based on shared neighbours • 1 for a fully connected graph • Number of messages ignored • Difficult to define evolution • No information on individuals But:
8 8 Clique of level c (valued graph) Def. : A clique of level c is a set where all members are directly connected one to another with a value c. C = 10 Clique of level 10 13 12 12 15 10 10 11 11
5 12 Gl2 7 10 Gl4 32 14 10 Gt Gn2 Gl1 8 Gl6 7 Gn1 Gl10 Computing cliques of level-c • Symetrisation of the adjaccency matrix • Definition of the threshold (c) • Selection of ties >= c=10
Gl2 Gl4 Gt Gn2 Gl1 Gl6 Gn1 Gl10 Computing cliques of level-c Each pair of members of the resulting subset exchanged at least 10 messages. Property: This is a cohesive subset
Comparing the 4 groups Aquitania Gallia Gallia Narbonensis Lugdunensis
Information given by Cliques • A good picture of the group structure • Highlights cohesive groups • Highlights isolated individuals … for a given threashold c !
Hierarchical Clusters Initially : identity partition : N clusters Repeat Find the most communicant pair of clusters Fusion of the pair in one cluster Print communication level (k) N = N-1 Until (N=1)
Max Min Hierarchical Clusters for Gallia GALLIA G G G G G G G G G G l l l n l G l n l l l 1 Level 3 2 1 1 t 4 2 6 5 9 0 ----- - - - - - - - - - - - 167 . . . XXX . . . . . . 108 . . . XXXXX . . . . . 83 . . XXXXXXX . . . . . 64 . . XXXXXXXXX . . . . 52 . XXXXXXXXXXX . . . . 42 XXXXXXXXXXXXX . . . . 29 XXXXXXXXXXXXXXX . . . 9 XXXXXXXXXXXXXXX XXXXX 5 XXXXXXXXXXXXXXXXXXXXX
Discussion • Cliques of level c gives: • precise communication structure (for a given c). • cohesive subsets • isolated individuals. • Clusters: • show more about intensity • Easier to compare groups.
Technical Conclusion • Cliques and clusters: complementary information • Process • Clusters analysis on all groups • Then threshold c • Level-c cliques
Further work • User friendly representations • Development • Experiment • SNA multiplexity: integration of all com tools into one representation • Exploration of SNA models
From data to social indices • LMS data extraction • relationshipdefinitions (graphs) • Apropriate model • User friendly representation
(questions) Activity as a whole • A LMS is an integration of many tools • The designer can use them differently : • Communication (Forum, e-mail, Chat, …) • Production (texts, drawing, cards, etc…) • Tests (quizzes, auto-evaluation,…) • Reading, contents pages navigation, etc. • One learner can participate to many courses • To reckon cohesion only on forum is not sufficient in general, but a good starting point in “simuligne”
Gl3 Gl2 Gl4 Gl5 Gt Gn2 Gl1 Gl9 Gl6 Gn1 Gl10 Using the Cliques of level c C=10