Equity
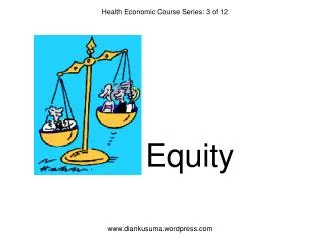
Equity. Major geographical inequalities exist This is a major development issue Progress in some areas by government – but little apparent appetite/ political will What can/ should donors do? . Health inputs. Western districts spend less per capita on basic services.

Equity
E N D
Presentation Transcript
Equity Major geographical inequalities exist This is a major development issue Progress in some areas by government – but little apparent appetite/ political will What can/ should donors do?
More than threefold variation in teachers Substantially lower inputs
Substantially worse outcomes Pass rate of PSLE exams, by region, 2010
A consistent picture across sectors NUTRITION – child stunting
Variation in water availability – but the pattern is different
Is this important? • Efficiency and effectiveness of spend • Waste of human capital • Politically destabilising • ‘multiplier of deprivation’
What should donors do? • Focus on big issues • Work across sectoral silos • Encourage consistent transparent approaches to monitoring progress • Recognise achievements • Human resource the major driver in social sectors • Pay and incentive strategy to meet sectoral priorities • Agree one system and support consistently • Celebrate achievements – eg in education staffing
There has been progress in key areas PTR is falling – but variance falls faster
PAF 2013 • Decrease the number of districts where: • Primary PTR is greater than 50 • Nurse / population ratio is worse than 3/1000
Key messages • Measuring geographic inequalities (let alone remedying them) is challenging. • LGA level data is fragmented and unreliable • Major geographical inequalities exist whether one considers inputs outputs or outcomes. • Key driver is staff recruitment and retention • Inequalities compound each other • Despite good political reasons for inertia, government has made progress in some areas • Donors talk a lot about inequality – but is our investment any better?