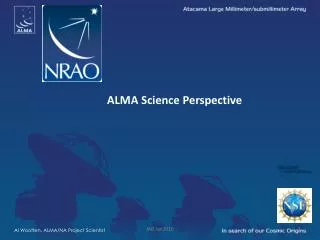
ALMA Science Perspective
690 likes | 799 Views
The Atacama Large Millimeter/submillimeter Array (ALMA) is a groundbreaking astronomical observatory that focuses on the millimeter and submillimeter spectrum. It enables scientists to explore cosmic phenomena through its ability to detect the Cosmic Microwave Background (CMB) and Cosmic Infrared Background (CIB). ALMA's technological advancements allow for precise imaging, spectral line observation, and high sensitivity for studying distant galaxies, star-forming regions, and protoplanetary disks. It serves as a crucial tool in understanding the structure and evolution of the universe.

ALMA Science Perspective
E N D
Presentation Transcript
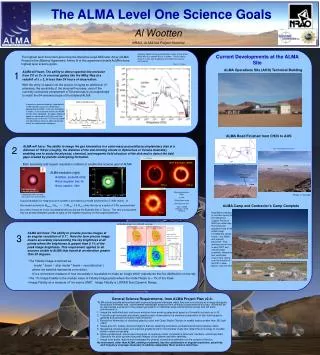
ALMA Science Perspective JAO Jan2010 Al Wootten, ALMA/NA Project Scientist
The mm/Submm Spectrum:Focus of ALMA • Millimeter/submillimeter photons are the most abundant photons in the cosmic background, and in the spectrum of the Milky Way and most spiral galaxies. • Most important component is the 3K Cosmic Microwave Background (CMB) • After the CMB, the strongest component is the CIB/THz component, which carries most of the remaining radiative energy in the Universe, and 40% of that in for instance the Milky Way Galaxy. • ALMA range--wavelengths from 1cm to ~0.3 mm, covers both components to the extent the atmosphere of the Earth allows. • CIB is a focus of THz astronomy
Data courtesy S. Radford Eleven Years of Data APEX July 2008 PWV < 200 μm for ~10% of time Can be better in winter Chajnantor: An Excellent Site for THz Astronomy JAO Jan2010
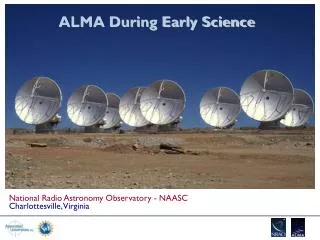
APEX • APEX is a slightly modified copy of the ALMA prototype built by Vertex. • It has operated on the ALMA site since 2005. • The surface is ~17 μm and has remained stable. • Observations have been published which were made in the 1.4 THz atmospheric window. • Sooo... • ALMA has an excellent and proven site for THz astronomy • ALMA has two prototype antennas; a copy of one is doing THz astronomy • Bids now being considered for operation • ALMA hasfourdifferent Production antennas—how do they compare? • What are ALMA’s science goals and how do they drive development?
ProjectSci IPT ensures ALMA meets three “level I” science goals: Spectral line CO/C+ in z=3 MWG < 24hrs resolve ProtoPlanetaryDisks at 150 pc – gas/dust/fields Precise 0.1” imaging above 0.1% peak High Fidelity Imaging. Routine sub-mJy Continuum / mK Spectral Sensitivity. Wideband Frequency Coverage. Wide Field Imaging Mosaicing. Submillimeter Receiver System (..& site..). Full Polarization Capability. System Flexibility (hardware/software). ALMA Science Requirements
>54-68 12-m antennas, 12 7-m antennas, at 5000 m altitude site. Surface accuracy ±25 m, 0.6” reference pointing in 9m/s wind, 2” absolute pointing all-sky. First two antennas meet these; accurate to <±16 m most conditions Array configurations between 150m to ~15 -18km. 10 bands in 31-950 GHz + 183 GHz WVR. 84-116 GHz “3” 125-169 GHz “4” 163-211 GHz “5” 6 rx only, dual polzn 211-275 GHz “6” 275-373 GHz “7” 385-500 GHz “8” 602-720 GHz “9” 787-950 GHz “10” initially partially populated 8 GHz BW, dual polarization. Flux sensitivity 0.2 mJy in 1 min at 345 GHz (median cond.). Interferometry, mosaicing & total-power observing. Correlator: 4096 channels/IF (multi-IF), full Stokes. Data rate: 6MB/s average; peak 60 MB/s. All data archived (raw + images), pipeline processing. Technical Specifications
ALMA Bands and Transparency B6 B7 B8 B9 B10 B2 B4 B1 B3 B5 ‘B11’ 0.5mm PWV ν<950 GHz 0.2mm PWV ν>950 GHz
With these specifications, ALMA improves Existing sensitivity, by about two orders of magnitude Best accessible site on Earth Highest performance receivers available Enormous collecting area (1.6 acres, or >6600 m2) Resolution, by nearly two orders of magnitude Not only is the site high and dry but it is big! 18km baselines or longer may be accommodated. Wavelength Coverage, by a factor of two or more Take advantage of the site by covering all atmospheric windows with >50% transmission above 30 GHz Bandwidth, by a factor of a few Correlatorprocesses 16 GHz or 8 GHz times two polarizations Scientific discovery parameter space is greatly expanded! Specifications Breed Transformational Performance
Highest Level Science Goals • Bilateral Agreement Annex B: • “ALMA has three level-1 science requirements: • The ability to detect spectral line emission from CO or C+ in a normal galaxy like the Milky Way at a redshift of z = 3, in less than 24 hours of observation. • The ability to image the gas kinematics in a solar-mass protostellar/ protoplanetary disk at a distance of 150 pc (roughly, the distance of the star-forming clouds in Ophiuchus or Corona Australis), enabling one to study the physical, chemical, and magnetic field structure of the disk and to detect the tidal gaps created by planets undergoing formation. • The ability to provide precise images at an angular resolution of 0.1". Here the term precise image means accurately representing the sky brightness at all points where the brightness is greater than 0.1% of the peak image brightness. This requirement applies to all sources visible to ALMA that transit at an elevation greater than 20 degrees. These requirements drive the technical specifications of ALMA. “ • A detailed discussion of them may be found in the 2004 ESA publication Dusty and Molecular Universeon ALMA and Herschel.
Science Goal I: Detect CO or C+ in MWG Combes • At z=2 this can be done for both lines • At z=3 this becomes difficult for the CO line • But notice the ‘tall pole’ atomic lines in the THz region, including C+ C+ CO J=3-2
Inverse K-correction, or magic of the submillimeter Super M82 from ISO, Beelen and Cox • As galaxies get redshifted into the ALMA bands, dimming due to distance is offset by the brighter part of the spectrum being redshifted in. Hence, galaxies remain at relatively similar brightness out to high distances. 10 11
CO rotational transitions (‘ladders’) Line ratios of CO rotational transitions depend on density and temperature. In Milky Way type galaxies: low-order transitions are brighter → low densities. In dense cores of starburst galaxies, higher-order transitions are brighter. At high z, higher excitation occurs, partly owing to higher CMB. Weiss et al. astro-ph/0508037
Science Goal I: Detect CO or C+ in MWG Maiolino and Testi Viable; depends on exact redshift and transparency window lineup. For MW galaxy, detection takes a few hours. Note that other lines on the plot, from luminous galaxies in the local Universe, may be detected, some at very high z. ALMA allows us to see the redshifted ‘tall pole’ THz lines to very high z.
Hubble Deep Field Rich in Nearby Galaxies, Poor in Distant Galaxies Source: K. Lanzetta, SUNY-SB Nearby galaxies in HDF Distant galaxies in HDF
Submm Sources at High and Low z Wang 2008 Simulation based on: (1) blank-field bright-end number counts (Wang, Cowie, Barger 2004) (2) lensing cluster faint-end number counts (Cowie, Barger, Kneib 2002) (3) redshift distribution of the submm EBL (Wang, Cowie, Barger 2004)
J1148+52: A Paradigm Distant Monster Galaxy • An early (z=6.42; 0.8Gyr) massive and extended region of tremendous star formation • ~1000 Msun/yr/kpc2 • Region ~750 pc radius • Similar to Arp220 but 100 times larger • Mass ~2 1010 Msun Walter et al 2009
J1148+5251: an EoR paradigm with ALMA CO J=6-5 Wrong declination (though ideal for Charlottesville)! But… High sensitivity 12hr 1s 0.2mJy Wide bandwidth 3mm, 2 x 4 GHz IF Default ‘continuum’ mode Top: USB, 94.8 GHz CO 6-5 HCN 8-7 HCO+ 8-7 H2CO lines Lower: LSB, 86.8 GHz HNC 7-6 H2CO lines C18O 6-5 H2O 658GHz maser? Secure redshifts Molecular astrophysics
ALMA into the EoR Spectral simulation of J1148+5251 • Detect dust emission in 1sec (5s) at 250 GHz • Detect multiple lines, molecules per band => detailed astrochemistry • Image dust and gas at sub-kpc resolution – gas dynamics! CO map at 0”.15 resolution in 1.5 hours CO HCO+ HCN CCH N. B. Atomic line diagnostics [C II] emission in 60sec (10σ) at 256 GHz [O I] 63 µm at 641 GHz [O I] 145 µm at 277 GHz [O III] 88 µm at 457 GHz [N II] 122 µm at 332 GHz [N II] 205 µm at 197 GHz HD 112 µm at 361 GHz
Bandwidth Compression Nearly a whole band scan in one spectrum LSB USB Schilke et al. (2000)
ALMA Design Reference Science Plan(DRSP) • Goal: To provide a prototype suite of high-priority ALMA projects that could be carried out in ~3 yr of full ALMA operations • Started planning late April 2003; outline + teams complete early July; submitted December 2003; updated periodically • >128 submissions received involving >75 astronomers • Review by ASAC members completed; comments included • Current version of DRSP on Website at: http://www.eso.org/sci/facilities/alma/science/drsp/ New submissions continue to be added.
Example: ALMA Deep Field Step 1: 300 GHz Continuum Survey • 4’ x 4’ Field (3000x3000 pixels) • Sensitivity: 0.1 mJy (5s) • 30 minutes per field • 140 pointings • A total of 3 days • 100-300 sources Determine the contribution of LBGs to the IR background
Example: ALMA Deep Field Step 2: 100 GHz Spectroscopic Survey • 4’ x 4’ Field ( 1000x1000 pixels) • Sensitivity: 7.5 mJy continuum and 0.02 Jy km/s for a 300 km/s line (5s) • 12 hrs per field • 16 pointings (a total of 8 days) • 4 tunings • One CO line for all sources at z>2 and two or more at z>6 • Photometric redshifts Obtain spectroscopic redshifts
Example: ALMA Deep Field Step 3: 200 GHz Spectroscopic Survey • 4’ x 4’ Field ( 2000x2000 pixels) • Sensitivity: 50 mJy continuum (5s) • 1.5 hrs per field • 90 pointings (a total of 6 days) • 8 tunings • Along with Step 2, at least one CO line for all redshifts, two CO lines at z>2 • Photometric redshifts
Gas Distribution and Kinematics Chapman et al. (2004)
Fully resolve the cosmic IR background into individual sources and determine FIR properties of LBGs and EROs as well as SMGs Quantify the properties of high-z dusty galaxies (SFRs, gas content, dynamical mass, etc.) Map the cosmic evolution of dusty galaxies and their contribution to the cosmic star formation history Summary: ALMA Deep Field
Birth of Stars and Planets • The nearest Star Formation regions: ~100 pc from the Sun • ALMA Beam at 300 GHz (100 pc): 1.5 AU • L1457 was once reported to lie at ~80 pc but now seems to be beyond 300 pc. • B68 lies at 95 pc (Langer et al.) • Rho Oph has parts as close as 120 pc out to 160 pc • Taurus has parts as close as 125 pc out to 140 pc • Coal Sack and Chameleon and Lupus are about the same. • The nearest protoplanetary regions lie at ~20 pc from the Sun • ALMA Beam at 300 GHz (20 pc): 0.3 AU • TW Hya at 56 pc, TW Hya assn is 10 Myr old, not likely to be forming many planets. • AU Microscopium, about 14 Myr old, lies only 10 pc from the Sun. • Beta Pictoris, 20 Myr old, lies at 17 pc • The nearest debris disks are even closer—around ~10% of nearby stars. • ALMA Beam at 300 GHz (3 pc): 0.05 AU • Epsilon Eridani lies a little over 3 pc from the Sun • Fomalhaut: 7.7 pc
Birth of Stars and Planets Evolutionary Sequence Observations— Molecular Cloud Core to Protostar (104 yrs) to Protoplanetary Disk (to ~106 yrs) to Debris Disk (to 109 yrs) Wilner et al 2002 Eisner et al 2008 Guilloteau et al 2008 Vega Dust Disk
Birth of Stars and Planets Evolutionary Sequence— Molecular Cloud Core to Protostar (104 yrs) to Protoplanetary Disk (to ~106 yrs) to Debris Disk (to 109 yrs) GBT/Mustang Synergy M. Wyatt; R. Reid Wolf and D’Angelo 2005 Lodato and Rice 2005 25AU 5AU 160 AU Vega Dust Disk
ALMA Observes Other Planetary Systems • Emphasis has been on optical and infrared wavelengths, as at these wavelengths the Spectral Energy Distributions (SED) of stars and extrasolar planetary systems peak. • ALMA, reaching long FIR wavelengths with great sensitivity and spatial resolution, will image dust and gas in these systems. • We consider the ability of ALMA to observe stars and extrasolar planetary systems in various stages of evolution. • See ALMA Memo 475.
Define a Figure of Merit For observations of any thermal blackbody (with emission which goes like -2), the figure of merit that one wants to maximize is X=2/S, where S is the noise at frequency . We want to maximize X because it is proportional to the SNR obtainable. For >350 GHz, need better weather so use pwv=1.5mm below and 0.5mm above this . Best Frequency for ALMA Continuum?
(1) Infancy. Image the luminous forming stars and planets directly, in emission from stellar photospheres, the gas and dust disk from which the stars formed, and the subsequent assembly of planets from the disk gas and dust. Disks are small, <900 AU, requiring high angular resolution (1”~140 AU in nearest star-forming regions) Except for the innermost regions, disks are cold (10-30K at R>100 AU) requiring high sensitivity Solar-mass stars will have rotation velocities around 2 km/s, turbulence around .2 km/s, requiring high spectral resolution. The only way to provide high spectral resolution AND high sensitivity is with large collecting area. ALMA. Forming Other Planetary Systems
The partially resolved dust emission probes now the disk at the scale of our solar system, but is not detectable further out with current millimeter array sensitivity.ALMA is sensitive enough to detect the dust emission in the outer optically thin dust disk. The CO emission from the outer and from the ~200 AU disk is now detectable. ALMA allows one to map optically thick CO lines at the scale of our Solar System ( ∼ 3 −10 AU), providing information about the gas content and its kinematics; current interferometers do not probe closer in than ~40AU. Hence one can compare both dust and gas in the same regions. The observations of optically thin lines are still difficult but possible. Long integration times should be used to detect and map molecules rarer than CO in order to investigate the chemistry of protoplanetary disks. Disk Structures
(2) Toddler. ALMA will be able to directly detect forming giant planets (‘condensations’) in protoplanetary disks, and the gaps created in these disks as the condensations grow. ‘Theoretical investigations show that the planet-disk interaction causes structures in circumstellar disks, which are usually much larger in size than the planet itself and thus more easily detectable.’ S. Wolf Forming Planets
Formation of Planetary Systems Wolf and D’Angelo 2005 HST view (left) sees opaque dust projected upon a bright background (if persent). In the ALMA view (above, the dust and the protoplanetary region appear bright.
(3) Adolescence. ALMA will be able to directly detect very young giant planets in the nearest star forming regions. Eris, for example, in our own system will be detected in seconds. Integrations times in days for several cases: Nearby Planets
(4) Adult - ALMA will be able to indirectly detect the presence of giant planets around nearby stars through the use of astrometry. ALMA will also be able to detect and image dust/debris disks around nearby stars (zodiacal analogs). A planet orbiting its central star causes the star to undergo reflexive motion about the barycenter ALMA would measure this motion accurately in its long configuration at submm wavelengths. ALMA could detect photospheres of e.g. 1000 stars well enough to detect a 5Jovian mass planet at 5AU. (10 minute integration). Inclination ambiguities for companions now known could be resolved. Indirect Detection of Mature Planetary Systems
Assume: 5AU orbit Three mass ranges: 5 Jovian, Jovian, Neptunian 10 minute integrations, 345 GHz, 1.5mm H2O Then: 800, 180, 0 Hipparcos stars about which a companion might be detected, virtually none solar type. 200, 120, 30 Gliese stars (d<25pc) about which a companion might be detected. 100, 30, 0 of these are solar type stars. Numerology
Specific Example • M dwarfs in solar neighborhood • There are ~90 M dwarfs within 15 pc of the Sun • Planets are hard to detect around them through radial velocity measurement of spectral lines owing to spectral crowding • A team led by Boss seeks planets through astrometry of these stars at Las Campanas • For ALMA at 870 microns, e.g. the M4V Barnard’s star at 1.8 pc distance would have a flux of about 2 mJy. At 15 pc, this is reduced to tens of microJy. Astrometric accuracy of 300mas would require ~20σ measurement, translating to days of integration, unlikely to win the hearts and minds of referees. For an hour’s integration, an ALMA Mdwarf survey to 5pc would seem most reasonable.
Summary • ALMA will image dust and gas in planetary systems at high resolution and sensitivity • Development program will upgrade receivers, implement new bands and enable techniques not within construction scope • Very long baseline interferometry—better astrometric precision • SupraTerahertz operation possible
In addition to dominating the spectrum of the distant Universe, millimeter/submillimeter spectral components dominate the spectrum of planets, young stars, many distant galaxies. Cool objects tend to be extended, hence ALMA’s mandate to image with high sensitivity, recovering all of an object’s emitted flux at the frequency of interest. Most of the observed transitions of the 142 known interstellar molecules lie in the mm/submm spectral regio. Here some 17,000 lines are seen in a small portion of the spectrum at 2mm. However, molecules in the Earth’s atmosphere inhibit our study of many of these molecules. Furthermore, the long wavelength requires large aperture for high resolution, unachievable from space. To explore the submillimeter spectrum, a telescope should be placed at Earth’s highest dryest site. Contributors to the Millimeter Spectrum Spectrum courtesy B. Turner (NRAO)
Measurement of Isotope Ratios • Owing to the large frequency separations, measurements of atomic isotope variants in molecules is often more straightforward than measurement in other spectral regimes • Additionally, astrophysical processes may increase fractionation in cold material, favoring observation in rotational molecular lines in cold cloud cores. • Of particular interest are the isotopes of abundant elements in molecules: H (D), 12C (13C), 14N (15N) and O (17O, 18O) • ALMA offers unique capabilities.
JAO Jan2010 How to make Interstellar NH2D etc. • The difference in bonding energy between H and D can provide clues to a molecule’s chemical history • A key reaction deuterating interstellar molecules occurs via exchange of D for H (1) AHn+ + HD AHn-1D+ + H2 + ∆E • ∆E is the zero-point vibrational energy difference between products and reactants • For A=H & n=2; A=C & n=3; A=C2 & n=2; note ∆E>0 • ∆E is 232K, 390 K and 550K, respectively, for H3+ CH3+ and C2H2+ • Since [D]/[H]~10-5 large D enhancement can indicate (1) is operating in a cold region • Notice that ∆E is much higher for CH3+ and C2H2+ than for H3+ • Molecules which gain their D enhancement from H3+ should become scarce in warm regions, • Examples • NH2D is an example of a molecule which should be enhanced only in cold regions, deriving its D from H2D+. • N2D+ is an example of a molecule which should be enhanced only in cold regions, deriving its D from H2D+. • DCO+ should be enhanced in cold regions through H2D+ + CO DCO+ + H2 • Those whose D donor is CH2D+ or C2HD+ will show persistent D enhancement in warmer regions • Some examples: • DCN as an example of possible D inheritance from CH2D+ • Also HDCO, more indirectly through CH2D + O HDCO + H • Alternatively, either could become heavily deuterated in grain mantles and subsequently liberated into the gas phase.
JAO Jan2010 Many Deuterating Reactions • The actual picture is more complex, with many variations on the basic theme • The more complex network must be employed to understand multiple deuteration in an ion-molecule framework. • The actual temperature dependence varies according to the reaction, but those in the same class are generally similar.
JAO Jan2010 Calculations of temperature dependence Roueff et al 2005
JAO Jan2010 Previous DCN Observations: General • Greason (1986) studied DCN enhancement in the ISM • Observed J=1-0, 2-1, 3-2 and 4-3 DCN; 1-0 and 3-2 H13CN • LVG modeling provides ratios • [DCN]/[HCN] remains high in warm sources where [DCO+]/[HCO+] vanishes, e. g. OMC1 (c.f. also Mangum, Plambeck and Wootten 1991 and Schilke 1992) • Leurini et al. (2006) find like enhancement in Orion Bar • Infer the presence of CH2D+
JAO Jan2010 Temperature Dependence of NH2D Shah and Wootten 2000
JAO Jan2010 Example: NH2D • Thought to form from reactions including N and H2D+ • Observed elevated levels of NH2D/NH3 in cold cores are ~30% (Shah & Wootten 2001) • ND2H/NH3 and even ND3/NH3 are observed to be high • In one source, N1333 IRAS4A, H2D+ is observed • Even D2H+ is observed in another highly deuterated cold core L1689N. • Could arise from grain mantles but • Distribution avoids dust-embedded sources (Shah and Wootten 2001; Roueff et al 2005) • Lower deuteration levels observed in warm cores (Jacq et al 1990) • OMC1 origin partly in Hot Core, partly in ion-molecule chemistry (Walmsley et al 1987; Friedel 1999) • But…even the extended ridge is too warm for H2D+ to be important • NH2D/NH3 can monitor the extent of grain, rather than ion-molecule, chemistry
JAO Jan2010 Ammonia Chemistry Aikawa et al
JAO Jan2010 Example: Cold Starless Core L1689N Wootten and Mangum 1994 • HCO+ 3-2, H13CO+ 3-2, HCN 3-2, SiO 2-1, and 1.3mm continuum emission from L1689N (Lisetal. 2002). The square locates the position of the DCO+ 3-2 peak, while the triangle locates the position of the IRAS source. • NH2D 1-0 integrated intensity from L1689N. The beam size of these OVRO Millimeter Array measurements, along with the intensity scale, are indicated. Deuterium enhancement of NH2D/NH3=.07 does not change over scales from 1000 to 10,000 AU in this frigid core; no embedded protostellar object detected.