Download
1 / 9
90 likes | 132 Views
Discover the strong correlation between oral reading fluency and reading comprehension in educational assessments. Dive into the statistical analysis of STAR (EL and Reading) scores and DIBELS Oral Reading Fluency among 12,220 students. With correlations reaching R=0.87 for Grade 1, explore the power of predictive accuracy and significance thresholds in educational measurement studies.

E N D
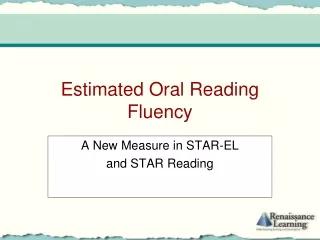
Estimated Oral Reading Fluency A New Measure in STAR-EL and STAR Reading
It’s all about correlations! • The link/correlation between fluency and reading comprehension is well documented. • Measures of fluency were first used as a proxy for measuring comprehension. • Reading First and DIBELS have placed great emphasis on fluency.
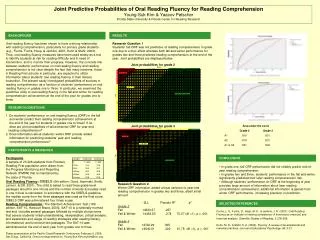
Resulted from a correlational study looking at STAR (EL and Reading) scores and DIBELS Oral Reading Fluency Statistically HUGE sample N=12,220 STAR and Est. ORF
Things to point out G4 – R=0.71 G3 – R=0.78 G2 – R=0.84 G1- R=0.87
Can be positive or negative 0.0 = no correlation 1.0 = complete, 1-to-1 correlation Correlations are deemed “statistically significant” at about 0.3, depending on the sample size (N) To turn a correlation into a more easily understood framework, square it. The result then represents, roughly, the percentage of the time that you could correctly accurately predict one measure with the other. Interpreting a Correlation
Things to point out • G4 – R=0.71 • G3 – R=0.78 • G2 – R=0.84 • G1- R=0.87
0.87 x 0.87 = 0.756 With one measure (STAR scale score or DORF) you could correctly accurately predict the other measure 75.6% of the time. Remember this formula, I C A Powerful Correlation!