Download
1 / 20
200 likes | 313 Views
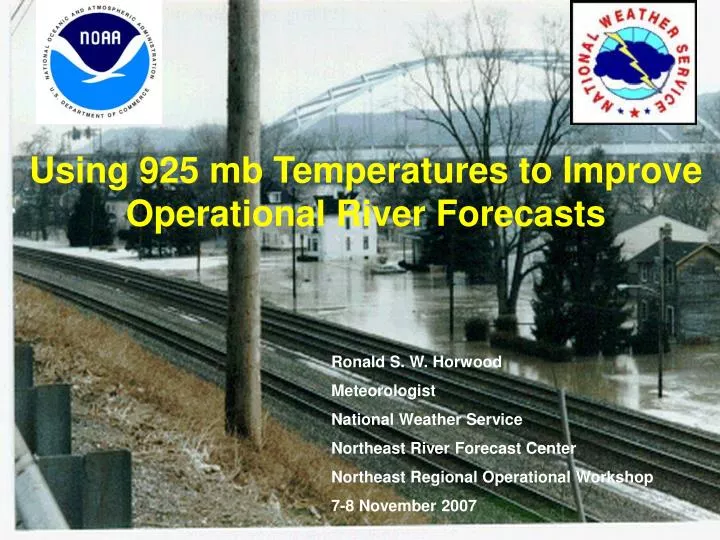
Using 925 mb Temperatures to Improve Operational River Forecasts. Ronald S. W. Horwood Meteorologist National Weather Service Northeast River Forecast Center Northeast Regional Operational Workshop 7-8 November 2007. Overview.

E N D
Using 925 mb Temperatures to Improve Operational River Forecasts Ronald S. W. Horwood Meteorologist National Weather Service Northeast River Forecast Center Northeast Regional Operational Workshop 7-8 November 2007
Overview • Background on Northeast River Forecast Center ( NERFC ) river forecast operations • Collaborative Project with NCEP – HPC • Case Simulations • Summary/Future Work • Questions/Comments
Background on NERFC Operations • The NERFC produces daily river stage forecasts for approximately 200 forecast points across New England and New York State.
Background on NERFC Operations - cont • River forecasts are produced on a 6-hourly time step. • Observed precipitation and temperature as well as forecast precipitation and temperature is input to the model as 6-hourly basin averages.
NERFC operations - cont • Since 2000…the NERFC has been transitioning from the Antecedent Precipitation Index ( API ) model to the Sacramento Soil Moisture Accounting model ( SACSMA ). • The API model is an index based event type model while the SACSMA model is a continuous model • SACSMA can be broken up into lower and upper elevations zones…each having different model states ( e.g. temperature…snow water equivalent…soil moisture etc ). • Zones delineated ~ 2000 feet. • Currently about 75% of NERFC forecast basins have transitioned to the SACSMA model.
Upper zone > 2000 ft Lower zone < 2000 ft
NERFC Operations - cont • Temperatures for the upper zones in the SACSMA model were being determined by applying a constant lapse rate that varied monthly across river basins. • During the winter season…problems were quickly noted during elevation snow events. • Calculated lapse rates were typically 3-5 degrees Farenheit between the upper and lower basins so when valley locations ( where the data is ) were 37-40 F and raining…upper zones would still be at or above the 34 F threshold for frozen precipitation and rain would be forecast. • We would also notice problems in freezing rain events since the lapse rate was always forecast to decrease with height.
Collaborative Project with HPC • NERFC Hydrometeorological Analysis and Support forecasters proposed a scheme to initialize upper zone forecast temperatures with 925 mb temperatures. • For most NERFC forecast basins with significant elevation above 2000 feet…there is little if any real-time temperature data available. • A constant monthly lapse rate between the lower and upper basins is not a valid assumption. • 925 mb ~ 3000 feet which is a nice approximation for the mean elevation for most upper zones in the NERFC service area and model data is readily available.
Collaborative Project with HPC • HPC agreed to provide the NERFC with 48 hours of 925 mb forecast temperatures 4 times per day from the 40 km NAM-WRF model. • Originally…the 12 km NAM-WRF was used for test purposes but problems arose when gridding the dataset. • HPC generates vgf files which are compatible with NMAP software which the NERFC uses to generate QPF and temperature forecasts. • The files are gridded by NERFC HAS forecasters and upper zone basin average temperatures are sent directly into NWSRFS. • The program became operational at the NERFC during March 2007.
Case Simulations • 2 case simulations will be shown for the NERFC forecast point at Au Sable Forks on the East Branch of the Au Sable River in northern New York State. • The East Branch of the Au Sable River is a 198 square mile basin draining the north slopes of the Adirondack mountain range. • The headwaters of the basin are steep and mountainous and drain terrain well over 4000 feet including the eastern slopes of New York State’s highest peak…Mount Marcy. • The outlet of the basin is a broad valley with gently rolling hills and elevation around 600 feet.
CASE Simulations - cont • We will examine two precipitation events across the basin…both with 2.00 inches of melted equivalent precipitation in 12 hours with the following initial conditions: • 1 inch of snow water equivalent across the upper elevation zone and 0.5 inches of water equivalent across the lower zone. • Simulations of constant lapse rate (old forecast method – 4F in Jan) will be compared to 925 mb temperature forecasts for the following two cases: • Lower elevation rain with an average temperature of 38F ( cold rain ) with cold air aloft. • Lower elevation freezing rain with an average temperature of 32F with warm air aloft.
Simulation 1 • Lower elevation rain at 38F with cold air aloft results in an all rain simulation using the constant lapse rate (old forecast method). • Using 925 mb forecast temperatures…snow is predicted in the upper basin which reduces runoff and lowers the river stage forecast.
Using the old forecast method of a constant lapse rate between the lower and upper zones…the entire basin would be above the melt threshold and all rain would be generated by the river model…in this case with a forecast for flooding.
Inserting the 925 mb temperatures for this simulation keeps areas in the upper zone (> 2000 feet) below freezing…allowing frozen precipitation to accumulate and decrease runoff. The resultant forecast is now below flood stage.
Simulation 2 • Lower elevation freezing rain results in cold air through both elevation zones and no runoff using the constant lapse rate (old forecast method). • Using 925 mb forecast temperatures…warm air aloft results in runoff and a rise in forecast river stage.
Using the old forecast method of a constant lapse rate between the lower and upper zones…the entire basin would be below the melt threshold and all precipitation would be frozen. This would produce a forecast with minimal rise.
Inserting the 925 mb temperatures for this simulation keeps areas in the upper zone (> 2000 feet) above freezing…allowing rainfall and snowmelt to occur. This results in a marked rise at the forecast point.
Summary/Future Work • By more accurately modeling temperatures in the upper zones (>2000 ft) of NERFC forecast basins...we believe resultant river forecasts will be improved. • This is especially true for elevation snow events in fall and spring. • A case study is planned from the winter of 2007/2008 with results published during FY 2009.