Download
1 / 110
1.1k likes | 1.29k Views
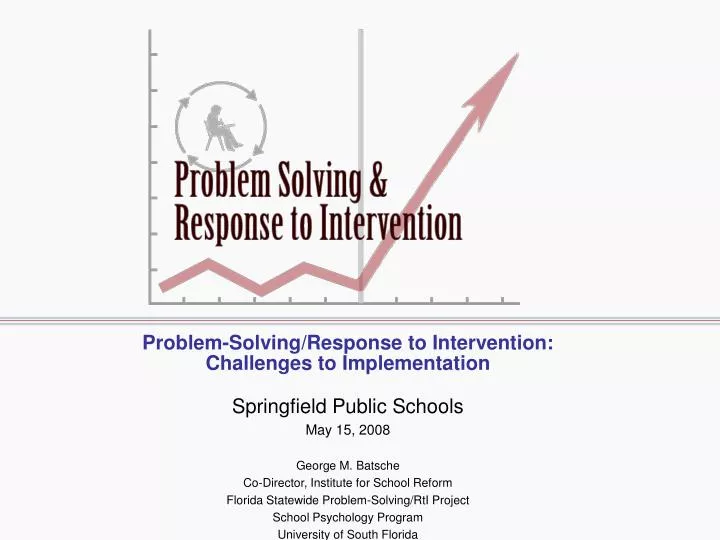
Problem-Solving/Response to Intervention: Challenges to Implementation. Springfield Public Schools May 15, 2008 George M. Batsche Co-Director, Institute for School Reform Florida Statewide Problem-Solving/RtI Project School Psychology Program University of South Florida. Resources.

E N D
Problem-Solving/Response to Intervention:Challenges to Implementation Springfield Public Schools May 15, 2008 George M. Batsche Co-Director, Institute for School Reform Florida Statewide Problem-Solving/RtI Project School Psychology Program University of South Florida
Resources • www.nasdse.org • Implementation Blueprints • “Primer” on RtI • Research Evidence • www.floridarti.usf.edu • www.fcrr.org • www.rtinetwork.org
The Vision • 95% of students at “proficient” level • Students possess social and emotional behaviors that support “active” learning • A “unified” system of educational services • One “ED” • Student Support Services perceived as a necessary component for successful schooling
Paradigm Shift • Eligibility focus • Diagnose and Place • Get label • Outcome focus • Problem Solving and Response to Intervention • Get help
Response to Intervention • RtI is the practice of (1) providing high-quality instruction/intervention matched to student needs and (2) using learning rate over time and level of performance to (3) make important educational decisions. (Batsche, et al., 2005) • Problem-solving is the process that is used to develop effective instruction/interventions.
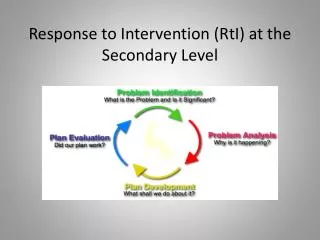
Problem Solving Process Define the Problem Defining Problem/Directly Measuring Behavior Problem Analysis Validating Problem Ident Variables that Contribute to Problem Develop Plan Evaluate Response to Intervention (RtI) Implement Plan Implement As Intended Progress Monitor Modify as Necessary
Steps in the Problem-Solving Process • PROBLEM IDENTIFICATION • Identify replacement behavior • Data- current level of performance • Data- benchmark level(s) • Data- peer performance • Data- GAP analysis • PROBLEM ANALYSIS • Develop hypotheses( brainstorming) • Develop predictions/assessment • INTERVENTION DEVELOPMENT • Develop interventions in those areas for which data are available and hypotheses verified • Proximal/Distal • Implementation support • Response to Intervention (RtI) • Frequently collected data • Type of Response- good, questionable, poor
Stages of Implementing Problem-Solving/RtI • Consensus • Belief is shared • Vision is agreed upon • Implementation requirements understood • Infrastructure Development • Problem-Solving Process • Data System • Policies/Procedures • Training • Tier I and II intervention systems • E.g., K-3 Academic Support Plan • Technology support • Decision-making criteria established • Implementation
The Process of Systems Change • Until, and unless, Consensus (understanding the need and trusting in the support) is reached no support will exist to establish the Infrastructure. Until, and unless, the Infrastructure is in place Implementation will not take place. • A fatal flaw is to attempt Implementation without Consensus and Infrastructure • Leadership must come both from the Principal and from the educators in the building.
Contextual Issues Affecting The Problem-Solving Process in General and Special Education • IDEA Re-Authorization • Focus on academic outcomes • General education as baseline metric • Labeling as a “last resort” • Increasing general education options • Pooling building-based resources • Flexible funding patterns • RtI Introduced as option for LD eligibility • ESEA Legislation-No Child Left Behind • National Emphasis on Reading • Evidence-based Interventions
Is It All About Reading? Maybe At First! • 52% of IDEA $$ go to LD Programs • 70% +/- of special education “activities” (e.g., evaluations, staffings, IEPs) related to LD cases • 94% of students in LD because of reading/language arts • 46% of IDEA $$ go to improve reading • Changes in LD Rules will affect the vast majority of special education “activities”
Why Problem-Solving ?BIG IDEAS • AYP and Disaggregated Data (NCLB) move focus of attention to student progress, not student labels • Building principals and superintendents want to know if students are achieving benchmarks, regardless of the students “type” • Accurate “placements” do not guarantee that students will be exposed to interventions that maximize their rate of progress • Effective interventions result from good problem-solving, rather than good “testing” • Progress monitoring is done best with “authentic” assessment that is sensitive to small changes in student academic and social behavior
Big Ideas (con’d) • Interventions must be “evidence based” (IDEA/NCLB) • Response to Intervention(RtI) is the best measure of problem “severity” • Program eligibility (initial and continued) decisions are best made based on RtI • Staff training and support (e.g., coaching) improve intervention skills • “Tiered” implementation improves service efficiency
How Do We Know If This is a General Education Initiative? • Priority of superintendent and school board • District Leadership Team • Strategic Plan • Focus is on effectiveness of Tier 1 for disaggregated groups • Unit of Analysis is the BUILDING
How Do We Know If This is a General Education Initiative? • Principal Led • Regular data analysis • Data Days • Team focuses in improving impact of core instruction • Prevention and Early Intervention • Screening and early intervention with Kindergarten students
Steps in the Problem-Solving Process • PROBLEM IDENTIFICATION • Identify replacement behavior • Data- current level of performance • Data- benchmark level(s) • Data- peer performance • Data- GAP analysis • PROBLEM ANALYSIS • Develop hypotheses( brainstorming) • Develop predictions/assessment • INTERVENTION DEVELOPMENT • Develop interventions in those areas for which data are available and hypotheses verified • Proximal/Distal • Implementation support • Response to Intervention (RtI) • Frequently collected data • Type of Response- good, questionable, poor
Problem-Solving/RtIResource Management 1-5% 1-5% 5-10% 5-10% Students 80-90% 80-90% • Public Education Resource Deployment • Support staff cannot resource more than 20% of the students • Service vs Effectiveness--BIG ISSUE Academic Behavior
How Does it Fit Together?Standard Treatment Protocol Results Monitoring Addl. Diagnostic Assessment Instruction All Students at a grade level Individualized Intensive Individual Diagnostic Intensive 1-5% weekly Small Group Differen- tiated By Skill Supplemental 5-10% Standard Protocol Behavior Academics 2 times/month Core Bench- Mark Assessment Annual Testing ODRs Monthly Bx Screening None Continue With Core Instruction Grades Classroom Assessments Yearly Assessments 80-90% Step 2 Step 3 Step 4 Step 1
Tier I Problem-Solving: Data and Skills Needed Tier I - Assessment Discipline Data (ODR) Benchmark Assessment School Climate Surveys Universal Screening FCAT Universal Screening District-Wide Assessments Tier I - Core Interventions School-wide Discipline Positive Behavior Supports Whole-class Interventions Core Instruction 10 - 15% 80 - 90%
Tier II Problem-Solving Data and Skills Needed 1 - 5% Tier II - Assessment Behavioral Observations Intervention Data Group Diagnostic Universal Screening Progress Monitoring Tier II - Targeted Interventions Targeted Group Interventions Increased Intensity Narrow Focus Linked to Tier I 10-15% 80 - 90% Tier I Assessment Tier I - Core Interventions 10 - 15% 80 - 90%
Data Infrastructure: Using Existing Data to Predict Intervention Needs • Previous referral history predicts future referral history • How do we interpret teacher referrals? • Previous intervention history predicts future intervention history • How do we use this information to establish an infrastructure for change?
Data-Driven Infrastructure:Establishing a Building Baseline • Code referrals (reasons) for past 2-3 years • Identifies problems teachers feel they do not have the skills/support to handle • Referral pattern reflects skill pattern of the staff, the resources currently in place and the “history” of what constitutes a referral in that building • Identifies likely referral types for next 2 years • Identifies focus of Professional Development Activities AND potential Tier II and III interventions • Present data to staff. Reinforces “Need” concept
Data-Driven Infrastructure:Establishing a Building Baseline • Assess current “Supplemental Interventions” • Identify all students receiving supplemental interventions • For those interventions, identify • Type and Focus (academic, direct instruction, etc) • Duration (minutes/week) • Provider • Aggregate • Identifies instructional support types in building • This constitutes Tier II and III intervention needs
Data For Each Tier - Where Do They Come From? Tier 1: Universal Screening, accountability assessments, grades, classroom assessments, referral patterns, discipline referrals Tier 2: Universal Screening - Group Level Diagnostics (maybe), systematic progress monitoring, large-scale assessment data and classroom assessment Tier 3: Universal Screenings, Individual Diagnostics, intensive and systematic progress monitoring, formative assessment, other informal assessments
Referral Analysis • 42% Noncompliance • 30% Off-Task/Inattention • 12% Physical/Verbal Aggression • 6% Relational Aggression • 10% Bullying
Building-Level Behavior Data • % Building %Referred Male 50% 80% White 72% 54% Hispanic 12% 20% African American 15% 24% Other 1% 2% Low SES 25% 50%
Tier Functions/Integration • How the Tiers work • Time aggregation • Tier integration
How the Tiers Work • Goal: Student is successful with Tier 1 level of support-academic or behavioral • Greater the tier, greater support and “severity” • Increase level of support (Tier level) until you identify an intervention that results in a positive response to intervention • Continue until student strengthens response significantly • Systematically reduce support (Lower Tier Level) • Determine the relationship between sustained growth and sustained support.
Integrating the Tiers • Tier 1 (Core) instruction present at all three levels • Purpose of Tier 2 is to improve success in Tier 1 • Purpose of Tier 3 is to improve success in Tier 2 • Is there a single “intervention” plan made up of different Tier services?
Integrating the Tiers • 5th grade student reading at the 2nd grade level • Tier 3 • Direct Instruction, Targeted, Narrow Focus (e.g., phonemic awareness, phonics, some fluency) • Tier 2 • Fluency, vocabulary, comprehension, pre-teach for Tier 1 • Tier 1 • Focus on comprehension, participation, scripted decoding • Use core materials for content • Progress monitor both instructional level and grade placement level skills