Download
1 / 19
190 likes | 325 Views
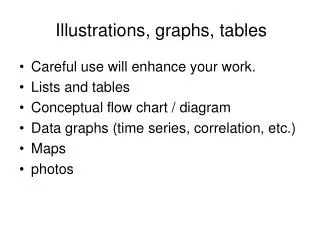
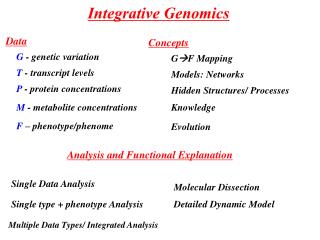
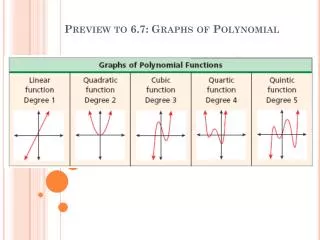
Preview: Some illustrations of graphs in Integrative Genomics. Biological Graphs and their models/combinatorics. Genomics Transcriptomics: Alternative Splicing. Genomics Phenotype: Genetic Mapping. Comparative Biology : Evolution of Networks. Networks in Cellular Biology.

E N D
Preview: Some illustrations of graphs in Integrative Genomics • Biological Graphs and their models/combinatorics • Genomics Transcriptomics: Alternative Splicing • Genomics Phenotype: Genetic Mapping • Comparative Biology: Evolution of Networks
Networks in Cellular Biology Dynamics - Inference - Evolution A. Metabolic Pathways Boehringer-Mannheim B. Regulatory Networks D. Protein Interaction Networks E. Alternative Splicing Graph (ASG) Enzyme catalyzed set of reactions controlling concentrations of metabolites Network of {GenesRNAProteins}, that regulates each other transcription. Some proteins stick together and appear together in complexes Determines which transcripts will be generated from a genes C. Signaling Pathways Cascade of Protein reactions that sends signal from receptor on cell surface to regulation of genes. Sreenath et al.(2008)
A repertoire of Dynamic Network Models To get to networks: No space heterogeneity molecules are represented by numbers/concentrations Definition of Biochemical Network: • A set of k nodes (chemical species) labelled by kind and possibly concentrations, Xk. • A set of reactions/conservation laws (edges/hyperedges) is a set of nodes. Nodes can be labelled by numbers in reactions. If directed reactions, then an inset and an outset. • Description of dynamics for each rule. ODEs – ordinary differential equations 2 2 Mass Action 3 7 1 1 k Time Delay Discrete Deterministic – the reactions are applied. Boolean – only 0/1 values. Stochastic Discrete: the reaction fires after exponential with some intensity I(X1,X2) updating the number of molecules Continuous: the concentrations fluctuate according to a diffusion process.
Number of Networks • undirected graphs • Connected undirected graphs • Directed Acyclic Graphs - DAGs • Interesting Problems to consider: • The size of neighborhood of a graph? • Given a set of subgraphs, who many graphs have them as subgraphs?
GenomicsTranscriptomics: Alternative Splicing • AS: one genomic segment can create different transcripts by skipping exons (sequence intervals) Human gene neurexin III-β Splicing RNA Transcription DNA Exon Intron Problem: Describe the set of possible transcripts and their probabilities. Define the alternative splicing graph (ASG) – • Vertices are exon fragments • Edges connect exon fragments observed to be consecutive in at least one transcript • This defines a directed, acyclic graph • A putative transcript is any path through the graph Paul Jenkins froim Leipzig et al. (2004) “The alternative splicing gallery (ASG): bridging the gap between genome and transcriptome”
GT: Alternative Splicing 2 4 1 3 1 2 3 4 Problem: Inferring the ASG from transcripts This ASG could have been obtained from as few as two ‘informative’ transcripts… • Maximimally informative transcripts • Minimally informative transcripts …or as many as six. There are 32 putative transcripts. • Random transcripts Paul Jenkins froim Leipzig et al. (2004) “The alternative splicing gallery (ASG): bridging the gap between genome and transcriptome” A Hierarchy of Models can be envisaged • Enrich the ASG to a Markov chain • Pairwise probabilities • Transcripts generated by a ‘walk’ along the ASG • A natural model for dependencies between donors and acceptors • Simpler still: model ‘donation’ and ‘acceptance’ separately • Jump ‘in’ or ‘out’ of transcript with well-defined probabilities • Isolated exons are included independently, based only on the strength of its acceptor site
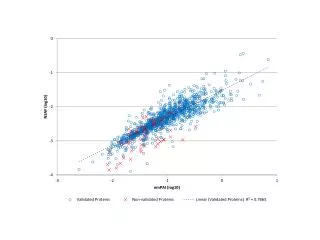
GT: Alternative Splicing 0.000 0.000 0.029 0.001 Human gene ABCB5 • The distribution of necessary distinct transcripts • The size of the inferrred ASG Paul Jenkins froim Leipzig et al. (2004) “The alternative splicing gallery (ASG): bridging the gap between genome and transcriptome” • Testing nested ASG modes • Pairwise model: V2 parameters • In-out model: V parameters • Models can be nested: • In-out pairwise non-parametric • Hence, given sufficient observations, likelihood ratio tests can determine the most appropriate model for transcript generation • The pairwise model was accepted, In-Out rejected
GF • Mechanistically predicting relationships between different data types is very difficult • Empirical mappings are important • Functions from Genome to Phenotype stands out in importance • G is the most abundant data form - heritable and precise. F is of greatest interest. Phenotype Protein Metabolite DNA mRNA “Zero”-knowledge mapping: dominance, recessive, interactions, penetrance, QTL,. Mapping with knowledge: weighting interactions according to co-occurence in pathways. Model based mapping: genomesystemphenotype Height Weight Disease status Intelligence ………. Environment
The General Problem is Enormous Set of Genotypes: 1 3* 106 • Diploid Genome • In 1 individual, 3* 106 positions could segregate • In the complete human population 2*108 might segregate • Thus there could be 2200.000.000 possible genotypes Partial Solution: Only consider functions dependent on few positions • Causative for the trait Classical Definitions: • Single Locus Dominance Recessive Additive Heterotic • Multiple Loci Epistasis: The effect of one locus depends on the state of another Quantitative Trait Loci (QTL). For instance sum of functions for positions plus error term.
Genotype and Phenotype Co-variation: Gene Mapping Decay of local dependency Time Reich et al. (2001) Genetype -->Phenotype Function Dominant/Recessive Penetrance Spurious Occurrence Heterogeneity genotype phenotype Genotype Phenotype Sampling Genotypes and Phenotypes Result:The Mapping Function A set of characters. Binary decision (0,1). Quantitative Character.
Pedigree Analysis & Association Mapping D r r M D M Association Mapping: Pedigree Analysis: 2N generations Pedigree known Few meiosis (max 100s) Resolution: cMorgans (Mbases) Pedigree unknown Many meiosis (>104) Resolution: 10-5 Morgans (Kbases) Adapted from McVean and others
Heritability: Inheritance in bags, not strings. The Phenotype is the sum of a series of factors, simplest independently genetic and environmental factors: F= G + E Relatives share a calculatable fraction of factors, the rest is drawn from the background population. This allows calculation of relative effect of genetics and environment Heritability is defined as the relative contribution to the variance of the genetic factors: Parents: Siblings: Visscher, Hill and Wray (2008) Heritability in the genomics era — concepts and misconceptions nATurE rEvIEWS | genetics volumE 9.255-66
Heritability Examples of heritability Heritability of multiple characters: Rzhetsky et al. (2006) Probing genetic overlap among complex human phenotypes PNAS vol. 104 no. 28 11694–11699 Visscher, Hill and Wray (2008) Heritability in the genomics era — concepts and misconceptions nATurE rEvIEWS | genetics volumE 9.255-66
Protein Interaction Network based model of Interactions PHENOTYPE NETWORK GENOME 2 n 1 The path from genotype to genotype could go through a network and this knowledge can be exploited Rhzetsky et al. (2008) Network Properties of genes harboring inherited disease mutations PNAS. 105.11.4323-28 Groups of connected genes can be grouped in a supergene and disease dominance assumed: a mutation in any allele will cause the disease.
PIN based model of Interactions Emily et al, 2009 Gene 1 Gene 2 Single marker association Protein Interaction Network PIN gene pairs are allowed to interact Phenotype i 3*3 table SNP 1 Interactions creates non-independence in combinations SNP 2
Comparative Biology Most Recent Common Ancestor ? Time Direction Parameters:time rates, selection UnobservableEvolutionary Path ATTGCGTATATAT….CAG ATTGCGTATATAT….CAG ATTGCGTATATAT….CAG observable observable observable Key Questions: Key Generalisations: • Which phylogeny? • Which ancestral states? • Which process? • Homologous objects • Co-modelling • Genealogical Structures?
Comparative Biology: Evolutionary Models Object Type Reference Nucleotides/Amino Acids/codons CTFS continuous time finite states Jukes-Cantor 69 +500 others Continuous Quantities CTCS continuous time countable states Felsenstein 68 + 50 others Sequences CTCS Thorne, Kishino Felsenstein,91 + 40others Gene Structure Matching DeGroot, 07 Genome Structure CTCS MM Miklos, Structure RNA SCFG-model like Holmes, I. 06 + few others Protein non-evolutionary: extreme variety Lesk, A;Taylor, W. Networks CTCS Snijder, T (sociological networks) Metabolic Pathways ? Protein Interaction CTCS Stumpf, Wiuf, Ideker Regulatory Pathways CTCS Quayle and Bullock, 06 Signal Transduction CTCS Soyer et al.,06 Macromolecular Assemblies ? Motors ? Shape - (non-evolutionary models) Dryden and Mardia, 1998 Patterns - (non-evolutionary models) Turing, 52; Tissue/Organs/Skeleton/…. - (non-evolutionary models) Grenander, Dynamics MD movements of proteins - Locomotion - Culture analogues to genetic models Cavalli-Sforza & Feldman, 83 Language Vocabulary “Infinite Allele Model” (CTCS) Swadesh,52, Sankoff,72, Gray & Aitkinson, 2003 Grammar Dunn 05 Phonetics Bouchard-Côté 2007 Semantics Sankoff,70 Phenotype Brownian Motion/Diffusion Dynamical Systems -
Likelihood of Homologous Pathways Number of Metabolisms: 2 1 + 2 symmetrical versions 3 4 PQ( , )=PQ( )PQ( -> ) Approaches: Continuous Time Markov Chains with computational tricks. MCMC Importance Sampling Eleni Giannoulatou
A Model for the Evolution of Metabolisms • A given set of metabolites: • A core metabolism: Restriction R: A metabolism must define a connected graph M + R defines 1. a set of deletable (dashed) edges D(M): 2. and a set of addable edges A(M): • A given set of possible reactions - • arrows not shown. • A set of present reactions - M • black and red arrows • Let m be the rate of deletion • l the rate of insertion • Then