Download
1 / 27
280 likes | 497 Views
Simulation of Large-Scale Communication Networks How Large? How Fast?. Mostafa Ammar, Steve Ferenci, Richard Fujimoto, Kalyan Perumalla, George Riley, Alfred Park, Hao Wu Georgia Institute of Technology. Outline. Quantifying Simulator Performance Parallel Network Simulation Software

E N D
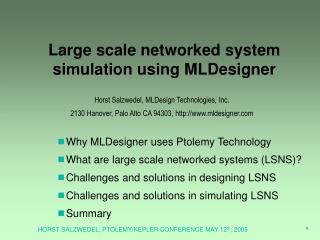
Simulation of Large-Scale Communication NetworksHow Large? How Fast? Mostafa Ammar, Steve Ferenci, Richard Fujimoto, Kalyan Perumalla, George Riley, Alfred Park, Hao Wu Georgia Institute of Technology
Outline • Quantifying Simulator Performance • Parallel Network Simulation Software • Federated approach to parallel network simulation • Experimental Study • Performance measurements ranging from one to over 1500 CPUs • Future Challenges
Large-Scale Network Simulation • Simulation an indispensable tool to study the behavior of computer communication networks • Network protocol evaluation • Security attacks, countermeasures • Interdependencies among critical infrastructures • Most studies examine a few to a few thousands of nodes • Useful to understand protocol behaviors (for example) • Limitations of existing tools • Large-scale network simulation offers • Verify validity of simulation results on small networks • Examine issues of scale • Validate theoretical models for large networks • Here, focus on packet-level simulation of wired networks • Discrete event simulation • Many tools exist: NS2, Opnet, Qualnet, …
Packet-Level Simulation Performance: A Quantitative Approach • One can characterize a simulation workload by the number of packet transmissions that must be simulated • Bulk of the computation involves simulating packets moving hop by hop through the network (queueing, transmitting over link, etc.) • Typically, two simulator events per “packet hop” • Define a packet transmission as sending one packet over a single communication link • One can characterize a simulator’s performance by the number of packet transmissions it can simulate in one second of wallclock time
Quantifying Packet-Level Simulator Performance • Execution time: T ≈ (NF * PF * HF) / PTS • NF = number of flows • PF = packets sent per flow • HF = average hops per flow • PTS = simulator speed (simulated packets transmissions / sec) • Ignores lost packets, protocol generated packets (e.g., acks) Number of packet transmissions (hops) to be simulated • Example • 500,000 active UDP flows, 1.0 Mbps per flow, average of 8 hops to reach the destination • Assume 1KByte packets (125 packets per sec per flow) • Workload: simulate 500 Million packet transmissions per second of network operation Real time performance: can simulate one second of network operation in one second of wallclock time
Time Parallel Simulation Space-parallel Simulation (parallel discrete event simulation) Our focus Scalability of Packet Level Simulators 1010 108 Simulator Speed - PTS (traffic that can be simulated in real time) 106 Sequential Simulation 104 102 108 106 104 102 1 Network Size (hosts, routers, etc.)
Outline • Quantify Packet-Level Simulator Performance • Parallel Network Simulation Software • Federated approach to parallel network simulation • Experimental Study • Performance measurements ranging from one to over 1500 CPUs • Future Challenges
Build “from scratch” approach: Substantial effort to build & validate new models Users must learn a new simulator SSFNet, TeD, Qualnet, ROSS, Javasim, Warped, TeleSim, AdHopNet… NS2 NS2 NS2 NS2 Backplane/RTI Federated simulation approach: • Integrated existing simulators via a software backplane/RTI • Exploit existing software, validated model & user base • Heterogenous simulations • UPS (queueing nets), PDNS, GTNets, Genesis Approaches to Parallel Network Simulation Large-scale parallel network simulator
Parallel Simulation Software • Parallel/Distributed NS (PDNS) • Developed by Riley (‘99); optimized by Perumalla and Park (‘03) • Based on ns-2.1b9/2.26 compiled for RedHat Linux using gcc-2.95 • Optimizations: NixVectors, message compression • Georgia Tech Nework Simulator (GTNetS) • Developed by Riley (‘02) • Network simulation environment designed for scalable, efficient, distributed execution • Current Models • Links: Ethernet, Point-to-Point • Routing: Static and NixVectors • Detailed IPV4 model • TCP: Tahoe, Reno, NewReno • UDP: On-Off Sources • Queuing: DropTail, RED • Under development: TCP-Sack, IEEE 802-11 Wireless, BGP (Using Zebra), DSR/AODV Wireless Routing • More detailed layer 2 & 3 models than NS; memory efficient
Internet Federates (e.g., ns2, gtnets) Simulator Simulator Jane Server RTI interface RTI interface RTI interface Jane Client Jane client/server architecture: Remote control via the Internet RTI Software / Interface (e.g., HLA) RTI-Kit: Primitives for building RTIs other libraries: buffer management priority queues, etc. MCAST (group communication) TM-Kit (time management algorithms) RTI FM-Lib (low level communications) Software Architecture
Outline • Quantify Packet-Level Simulator Performance • Parallel Network Simulation Software • Federated approach to parallel network simulation • Experimental Study • Performance measurements ranging from one to over 1500 CPUs • Future Challenges
Performance Study • Goal: Assess performance / scalability of parallel, federated, network simulators Server • Benchmark network (Dartmouth, Nicol, et al.) • Building Block: Campus Network • 538 nodes • 504 clients • Multiple Campus Networks (CNs) connected to form a ring • Up to 10,000 campus networks (~5 Million nodes) • Links up to 2Gb/s • Link delay ranging from 1ms to 200ms • Additional chord links LAN (4 sub-LANs, 42 hosts) Single Campus Network Figure courtesy of David Nicol
Network Topologies: CampusNet(Dartmouth) Single Campus Network • 538 nodes • 543 links 10 campus networks connected in ring
MilNet (Dartmouth, UCR) Campus: 538 nodes • Backbone based on maps collected by RocketFuel • Six major U.S. ISPs (3,036 routers) • Link bandwidth based on network maps published by each ISP • Link delay based on distance • 164 Military LANs, 3 types Dartmouth: 3886 nodes ORNL: 9177 nodes
Traffic Scenarios • CampusNet ftp traffic (Dartmouth) • Each client sends 500K bytes (file xfer; TCP request) from server in next campus network in ring • Variations: traffic to distant servers, UDP, mix of TCP and UDP traffic, long data transfers • Web traffic • Based on [Mah, Infocom ‘97] • DDoS attack, detection, filtering • SYN Flood, UDP storm • Background traffic from CAIDA traces, ISI RAMP • Worm attacks • UDP worm propagation
Hardware Platforms • Sequential: Sun / Solaris • Ultra-80, UltraSPARC-II 450MHz • 4GB memory • Parallel: Intel / RedHat Linux 7.3 • 8-way Pentium-III XEON (2MB L2 cache) SMP • 550MHz clock speed • 4GB memory • 17 SMPs (136 CPUs) connected via Gigabit Ethernet • Performance measurements are conservative (due to hardware performance)
Sequential Performance Comparison (Single Campus Network) * A packet transmission involves simulating a packet transmission over a single link ** Includes NixVectors optimization Average end-to-end delay differed by less than 3%
Sequential Performance 1 Campus Net • Campus network topology; increase number of CNs in ring configuration • FTP traffic
PDNS Performance on Cluster(Perumalla/Park) • Each processor simulates 10 CNs (scale problem size) • Up to 120 processors simulating 645,600 nodes
PDNS: More Runs • Scenario 1: Campus Network Scenario • Optimized PDNS • 658,512 nodes, 616,896 traffic flows • 5.5 Million PTS on 136 Processors • Chord links, randomized traffic reduce performance • increased interprocessor communications • 2.0 to 2.6 Million PTS on 128 processors, 482K nodes • Scenario 2: Denial of Service Attack Scenario • SynFlood attack, 25,000 attacking hosts • Campus network configuration • 50% original traffic in “background” • 1.5 Million PTS on 136 Processors • Scenario 3: Milnet Network Scenario • 166,478 nodes • 142,083 FTP flows (based on CAIDA traces) • 1.4 million PTS on 64 processors
Lemieux Supercomputer • 750 HP-Alpha ES45 servers • 4Gbytes memory per server • 4 CPUs per server • 1GHz CPU • 3000 CPUs total • 64-bit computing • Quadrics interconnect Pittsburgh Supercomputing Center http://www.psc.edu/machines/tcs/lemieux.html
PDNS Performance on PSC(Perumalla) • 147K PTS on one CPU • Campus network topology, FTP traffic (500 packets/flow, TCP) • Scale problem size & number CPUs (up to ~4 million network nodes) • Performance up to 106 Million PTS
GTNetS Performance (PSC)(Riley) • Run 1: Campus network configuration • 512 Processors • 5.5 Million Nodes, 5.2 Million flows • 12.3 Million PTS • Run 2: Near real time web traffic simulation • Empirical HTTP Traffic model [Mah, Infocom ‘97] • 512 processors • 1.1 million nodes, 1.0 Million web browsers • 20.5 Million TCP Connections • 541 seconds of wallclock time to simulate 300 seconds of network operation
Performance Summary Execution speed normalized to single CPU PSC performance
Summary and Current Work • Simulated packet transmissions/sec (PTS) benchmarking metric • Large-Scale network simulation is feasible • >100 Million PTS can be achieved to simulate networks containing millions of nodes and traffic flows • Performance highly network and scenario dependent • Current Work • More complex network configurations • Irregular traffic, topologies • Synchronization protocols • Improving usability of the tools
Many Challenges Remain Simulating the Internet remains a major challenge • Modeling issues [Floyd/Paxson] • Building credible large-scale models and scenarios • Verifying and validating large-scale simulations • Topology? Traffic? • Methodologies and tools to effectively utilize the simulators • How large is large enough? • Tools & Parallel Simulation Issues • Robust performance • Making parallel simulation more transparent, “automatic” • Access to HPC platforms • Visualization Tools • Application Studies • Killer apps?
Acknowledgements Funding for this research provided by • NSF Grants ANI-9977544 and ANI-0136939 • DARPA Contract N66001-00-1-8934