Download
1 / 54
540 likes | 563 Views
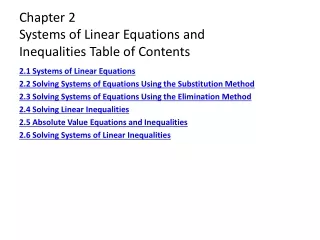
Chapter 2 Systems of Linear Equations and Inequalities Table of Contents. 2.1 Systems of Linear Equations 2.2 Solving Systems of Equations Using the Substitution Method 2.3 Solving Systems of Equations Using the Elimination Method 2.4 Solving Linear Inequalities

E N D
Chapter 2 Systems of Linear Equations andInequalities Table of Contents 2.1 Systems of Linear Equations 2.2 Solving Systems of Equations Using the Substitution Method 2.3 Solving Systems of Equations Using the Elimination Method 2.4 Solving Linear Inequalities 2.5 Absolute Value Equations and Inequalities 2.6 Solving Systems of Linear Inequalities
Your company wants to print some flyers for advertising a new product. The printer has two options to produce the flyers. The traditional printing cost $250 for setup and $0.15 per page printed. To print the flyers digitally they charge $50 for setup and $0.20 per page printed.a. Write equations for the cost to print n flyers using these two printing options. Back to Table of Contents 2.1-1
Your company wants to print some flyers for advertising a new product. The printer has two options to produce the flyers. The traditional printing cost $250 for setup and $0.15 per page printed. To print the flyers digitally they charge $50 for setup and $0.20 per page printed.b. Graph the two equations on the same calculator window. Back to Table of Contents 2.1-1
Your company wants to print some flyers for advertising a new product. The printer has two options to produce the flyers. The traditional printing cost $250 for setup and $0.15 per page printed. To print the flyers digitally they charge $50 for setup and $0.20 per page printed.c. Find the number of flyers that will result in the same cost for both printing methods. Back to Table of Contents 2.1-1
Solve the following system by graphing the equations by hand Back to Table of Contents 2.1-2
The percentage of renewable energy produced using geothermal and wind is given in the table. Source: US Statistical Abstract 2009.a. Find a model for the percent of renewable energy produced by using geothermal energy. Back to Table of Contents 2.1-3
The percentage of renewable energy produced using geothermal and wind is given in the table. Source: US Statistical Abstract 2009.b. Find a model for the percent of renewable energy produced by using wind. Back to Table of Contents 2.1-3
The percentage of renewable energy produced using geothermal and wind is given in the table. Source: US Statistical Abstract 2009. c. Estimate the year in which the percentages of geothermal and wind energy are the same. Back to Table of Contents 2.1-3
Use the table on the calculator to numerically find the solution to the system. Back to Table of Contents 2.1-4
For each of the following systems of equations, determine if the system is consistent or inconsistent. If the system is consistent determine if the lines are independent or dependent. Give the solution to the system.a. Back to Table of Contents 2.1-5
For each of the following systems of equations, determine if the system is consistent or inconsistent. If the system is consistent determine if the lines are independent or dependent. Give the solution to the system.b. Back to Table of Contents 2.1-5
For each of the following systems of equations, determine if the system is consistent or inconsistent. If the system is consistent determine if the lines are independent or dependent. Give the solution to the system.c. Back to Table of Contents 2.1-5
Solve the system using the substitution method. Back to Table of Contents 2.2-1
Using the models from Section 2.1 for geothermal and wind energy, find the year when the amount of geothermal and wind energy produced will be the same.Where G(t) is the percentage of renewable energy produced using geothermal energy t years since 2000 and W(t) is the percentage of renewable energy produced using wind energy t years since 2000. Back to Table of Contents 2.2-2
Solve the following systems using the substitution method.a. Back to Table of Contents 2.2-3
Solve the following systems using the substitution method.b. Back to Table of Contents 2.2-3
As a new sales employee you are given two salary structures to choose from. The first option has a base salary of $1200 per month and 7% commission on sales made. The second option has a base salary of $800 per month and 9% commission on sales made.a. Find equations to represent the two salary options. Back to Table of Contents 2.2-4
b. Find what sales amount will result in the same monthly salary for both options. Back to Table of Contents 2.2-4
When Raja retired she received a $760,000 lump sum retirement package. She wants to invest this amount in two accounts. The first account pays 4% simple interest and the second account pays 7% simple interest. Raja wants to earn $47,500 per year in interest to live on.a. Write a system of equations that will help Raja find the amount she should invest in each account. Back to Table of Contents 2.2-5
b. How much should Raja invest in each account to earn the $47,500 she wants each year? Back to Table of Contents 2.2-5
Solve the following systems. Label each system as consistent or inconsistent. If the system is consistent, determine if the lines are independent or dependent.a. Back to Table of Contents 2.2-6
Solve the following systems. Label each system as consistent or inconsistent. If the system is consistent, determine if the lines are independent or dependent.b. Back to Table of Contents 2.2-6
Solve the system using the elimination method. Back to Table of Contents 2.3-1
Yomaira need 70 ml of 45% saline solution for a science experiment. She has some 60% saline solution and some 20% saline solution. How much of each of these solutions should Yomaira combine to get the 70 ml of 45% saline solution she needs? Back to Table of Contents 2.3-2
Solve the system of equations using the elimination method. Back to Table of Contents 2.3-3
Solve the following systems of equations using the elimination method.a. Back to Table of Contents 2.3-4
Solve the following systems of equations using the elimination method. b. Back to Table of Contents 2.3-4
Solve the following inequalities.a. b. Back to Table of Contents 2.4-1
Using the printing flyers classroom example from section 2.1 we get the followingn = Number of flyers printed.T(n) = Cost in dollars to print flyers using the traditional printing method. D (n)= Cost in dollars to print flyers using digital printing.Find for what numbers of flyers the traditional printing method would be cheaper than the digital prints. Back to Table of Contents 2.4-3
The percentage of United States population with high blood cholesterol is given in the table. Source: CDC 1991-2003 Behavioral Risk Factor Surveillance System.a. Find equations for models of these data. Back to Table of Contents 2.4-4
The percentage of United States population with high blood cholesterol is given in the table. Source: CDC 1991-2003 Behavioral Risk Factor Surveillance System.b. Use the models to approximate when the percent of men with high blood cholesterol is higher than the percent of women. Back to Table of Contents 2.4-4
Solve the inequality numerically using the calculator table. Back to Table of Contents 2.4-5
Solve the inequality graphically. Back to Table of Contents 2.4-6
Solve the following equations.a. b. Back to Table of Contents 2.5-1
Solve the following equations.c. Back to Table of Contents 2.5-1
Estella is driving from Savannah, Georgia to Washington, D.C. Along the way she will pass through Richmond, Virginia. Estella’s distance from Richmond can be modeled by the functionwhere D(t) is Estella’s distance in miles from Richmond after driving for t hours. Find the time when Estella will be 40 miles from Richmond. Back to Table of Contents 2.5-2
Write the given interval using a compound inequality.a.b. Back to Table of Contents 2.5-3
Solve the following inequalities. Give the solution as an inequality and graph the solution set on a number line.a. b. Back to Table of Contents 2.5-4
A person with mild high blood pressure will have a systolic pressure (first number) that satisfies the inequalitywhere S is a person’s systolic pressure in millimeters of mercury (mmHg ).Find the range of systolic pressures that people with mild high blood pressure will have. Back to Table of Contents 2.5-5
Write the given interval using a compound inequality. Back to Table of Contents 2.5-6
Solve the following inequalities. Give the solution as an inequality. Graph the solution set on a number line.a. b. Back to Table of Contents 2.5-7
A person with high or low blood pressure will have a diastolic pressure (second number) that satisfies the inequality where D is a person’s diastolic pressure in millimeters of mercury (mmHg).Find the diastolic blood pressures that would be considered high or low. Back to Table of Contents 2.5-8
A yard equipment manufacturer produces lawn mowers and roto-tillers in the same plant. Each mower requires 4 hours to produce while roto-tillers require 7 hours to produce. If the plant operates 70 hours per week, what combinations of mowers and roto-tillers can they produce in a week? Back to Table of Contents 2.6-1
Graph the following inequalities by hand:a. Back to Table of Contents 2.6-2
Graph the following inequalities by hand:b. Back to Table of Contents 2.6-2
Graph the following inequalities by hand:c. Back to Table of Contents 2.6-2
Find the inequality for the given graph. Back to Table of Contents 2.6-3
The yard equipment manufacturer we discussed with example 1 had a time constraint that they could not exceed 70 hours of production per week. Each mower requires 4 hours to produce while roto-tillers require 7 hours to produce. The same plant must stay in production at least 40 hours per week.a. Create a system of inequalities to model this situation. Back to Table of Contents 2.6-4
The yard equipment manufacturer we discussed with example 1 had a time constraint that they could not exceed 70 hours of production per week. The same plant must stay in production at least 40 hours per week.b. Graph the solution set for this system. Back to Table of Contents 2.6-4
The yard equipment manufacturer we discussed with example 1 had a time constraint that they could not exceed 70 hours of production per week. The same plant must stay in production at least 40 hours per week.c. Can the plant produce 8 mowers and 4 roto-tillers in a week? Back to Table of Contents 2.6-4