Global Temperature Changes and Their Impact on Climate
Explore the global temperature change trends over the past century, the impact on sea levels and ecosystems, greenhouse gas effects, human activities contributing to global warming, and potential feedback mechanisms. Understand the implications of rising temperatures on weather patterns, sea levels, biodiversity, and human health.

Global Temperature Changes and Their Impact on Climate
E N D
Presentation Transcript
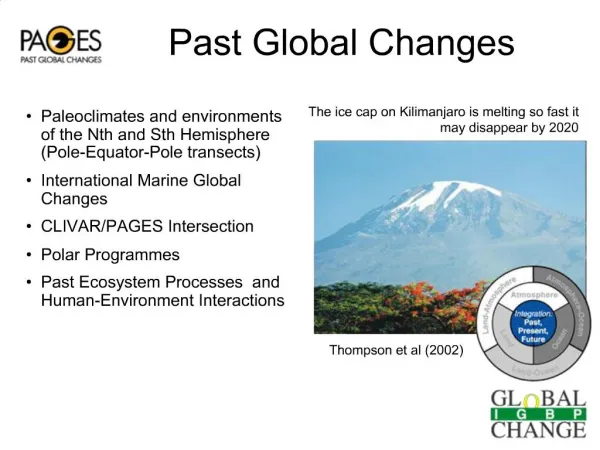
Global Temperature Change Globally, the 10 hottest years on record have occurred since 1991(Science [2004] 303:176). Temperatures have risen 0.6°C in the past 100 years, and global sea levels have risen ~20 cm because of melting ice and thermal expansion of the oceans. Large icebergs have recently been breaking off of Antarctica. Arctic surfaces have warmed 50 C in the last 100 years.
Global Temperature Change In Britain, usage of the Thames Barrier, which protects London from flooding, has increased from less than once a year in the 1980s to more than 6 times a year in 2003. In less than 200 years the atmospheric concentration of greenhouse gases has increased by 50% relative to pre-industrial levels. Three socioeconomic scenarios indicate in the best case scenario by 2080 risk of floods will increase 30x present levels. In the high emission scenario by 2080 flood levels expected once every 100 years would recur every 3 years.
Global Temperature Change Reducing carbon emissions does not necessarily equate with lower standards of living. Between 1990 and 2000, Britain’s economy grew by 30%, employment grew by 4.8%, and greenhouse gas emission fell by 12% due to use of less fossil fuels. During the same period from 1990 to 2000 the Chinese economy grew by 60% and emissions fell. However, the USA has not ratified the Kyoto Protocol and has not implemented the emissions goals set by the Protocol. The UK is responsible for ~2% of the world’s emissions, while the USA is responsible for more than 20% (with ~4% of the world’s population). Science (2004) 303:176 Climate Change Science: Adapt, Mitigate, or Ignore
Global Temperature Change Projections for increased global temperatures up to 50 C in the next 100 years. (This is equal to a temperature change between the waxing and waning of ice ages.)
The Gases of Global Warming There are five main greenhouse gases (plus water and ozone). CO2 and CH4 have not been this high in 160,000 years.
Anthropogenic Causes of Global Warming The Gases of Global Warming: Carbon dioxide: 50% of the effect of global warming. Fossil fuel, deforestation, agriculture, and industry. Methane: 16%. Rice paddies, bogs, termites/deforest, landfills, cattle Chlorofluorocarbons: 20%. Freon, styrofoam, propellants. Nitrous oxide (N2O): 6%. From fertilizers, livestock wastes, fuel combustion. Ozone (O3): 8%. Tropospheric ozone is a secondary air pollutant caused by photochemical reactions.
Sources of CO2 Emission and Increases in CO2 During The Last 5 Decades.
Greenhouse GasPre-Indus.1997GH Warming Carbon Dioxide 288 ppm 367 ppm ~50% Methane 848 ppb 1745 ppb 15-20% Chlorofluorocarbon0 262 ppt 15-20% Nitrous Oxide 285 ppb 533 ppb 5-6% Tropospheric Ozone ~8%
Global Circulation Models • Predict the changes in movement of surface water, groundwater, ocean circulation, atmospheric circulation, andcloud cover. The surface of the earth is divided into 520 cells (size of Oregon) by 20 cells deep. Each cell interacts with the cells adjacent to it.
Possible Feedbacks To Global Warming • 1. Greenland and Antarctic ice sheets = large mirrors, reflecting light into space and cooling the planet. Melting of this ice could cause greater warming. • 2. Increased water in air could cause less light penetration and decrease warming. But if cirrus clouds, it could increase global warming. • 3. Increased temperatures could • cause more snow on ice sheets, • thereby decreasing global • warming.
Possible Feedbacks To Global Warming • 4. Ocean Conveyor Belt, which transports heat from the tropics to the northern hemisphere. Warming of northern oceans will change pattern producing: • Cooling in Europe and warming in the tropics. • -Decreased carbon dioxide uptake into oceans, causing greater global warming.
The Effects of Global Warming Rising Sea Level Flood coastal cities. Salt intrusion could contaminate coastal aquifers Changes in Precipitation Pattern and Temperature Increased hurricanes and typhoons. Some areas will become drier, some wetter.
Effects of Global Warming On Living Organisms • 1. Increase bacterial decay, which could exacerbate global warming. • 2. Increase the spread of diseases: malaria, encephalitis. • 3. Increased invasion of pest species (Med. fruit fly). • 4. Coral bleaching due to increased stress/disease.
Effects of Global Warming On Living Organisms • 5. Fish death due to increased water temps (or loss of oxygen from increased algae growth) (trout bass and catfish). • 6. Canada and Russia may increase agricultural productivity, while tropical countries have declining productivity. • 7. Fast climate change could cause plant and animal species not to be able to migrate to changing climates.
Effects of Global Warming In Indiana • Increased precipitation, but increased temperatures will cause greater evaporation, so lake and river levels will decline. • Effects: Locks/Dams, Ship Docks. • Hydropower • Water Quality • Declining Corn Yields
How Can We Deal With Global Warming • Prevention of Global Warming: • Kyoto Protocol of 1997: legally binding timetables to cut emissions of greenhouse gases. • Alternatives to hydrocarbons must be found/used. • Trapping CO2 instead of being released • (need new capturing technologies) • Mitigation of Global Warming: • Increase forest planting (area size of U.S. planted/year to totally offset deforestation and CO2 emissions) • Pay tropical countries for keeping forests. • Increase energy efficiency • Adaptation to Global Warming: • Dikes and levees • Drought resistance plants and trees.
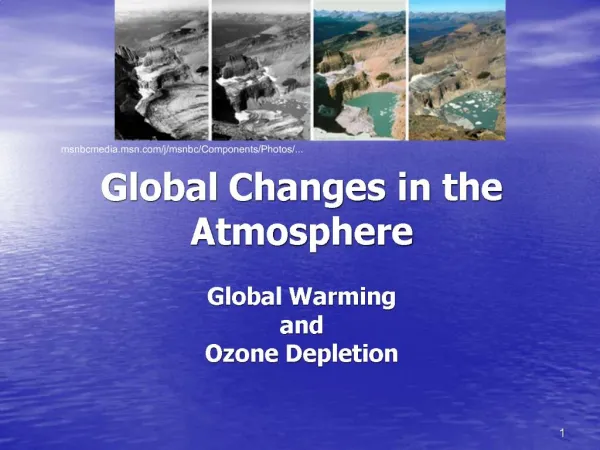
Ozone Depletion in the Stratosphere Ozone absorbs UV radiation. Other chemicals that will absorb UV include DNA, but DNA is often mutated in the process.
Ozone Depletion In The Stratosphere Chemical Causes of Ozone Depletion 1. Chlorofluorocarbons (CFCs) - CF2Cl2 - freon, propellants, styrofoam. Non-reactive, non-corrosive, non-toxic, non-flammable. 2. Halons - Fire extinguishers. Bromine compounds. 3. Methyl bromide - Fumigant in agriculture. 4. Methyl chloroform - 1,1,1 trichloroethane. Degreaser. 5. Carbon tetrachloride - Pesticides
How Ozone Depletion Takes Place CFCs are usually stable, but UV is high energy and can break the chlorine bond. Chlorine can react with ozone, converting it to O2 and ClO. ClO can react with ozone, producing O2 again.
How Ozone Depletion Takes Place Chlorine can be bound up in water soluble molecules - HCl and lost to rain, but 100-10,000 molecules of ozone can be destroyed before it occurs. But, Ozone ‘holes’ can occur when cold temperatures allow chlorine to be isolated out of protective reservoir molecules. Adheres to ice crystals and can react with ozone more readily.
Effects of Ozone Depletion • (1-5% loss of ozone per decade, depending on the estimate). Dramatic increases in UV-B radiation (In New Zealand, 12% greater in a decade). • 1. Skin cancer, cataracts, weakened immunity to diseases • 2. Ecosystem disruption: Damages phytoplankton, reducing their productivity, effecting rest of food web (p.76)
Protecting the Ozone Layer - Alternatives to CFCs Montreal Protocol:treaty to decrease/eliminate CFCs. 1985: 917,000 metric tons CFCs 1997: 56,500 metric tons Hydrofluorocarbons - not ozone destroyer (but is a greenhouse gas). Hydrochlorofluorocarbons - shorter lived, but still can deplete ozone.
Measuring Acidity - pH pH = negative log of the hydrogen ion concentration in a solution. Each unit has 10x change in acidity. Rain: normally a pH of 5 to 6—because of CO2 dissolved in the water makes carbonic acid. But in Eastern US, pH of rainwater can be 4 or even 3.
Origins of Acid Deposition Nitrogen oxides - vehicles and industry Sulfur oxides - power plants, smelters, industrial boilers
Effects of Acid Deposition 1.Forest decline: • Leaching of nutrients from soil (calcium and magnesium) and increasing heavy metals (aluminum), which causes poorer tree growth. • b. Acidity of soil also damages roots. Damage to leaves and bark due to acidity.
Effects of Acid Deposition 1.Forest decline: • Black forest of Germany: up to 50% of trees are dead or severely damaged. Cloud water in eastern U.S. is 5 times more acidic than precipitation. Trees in high altitudes are bathed in this.
Effects of Acid Deposition 2. Aquatic animal declines in rivers and lakes: • Dramatic differences in tolerance limits: From mussels and mayflies, which are intolerant to low pH, to some insects that are very tolerant to pH.
Effects of Acid Deposition 2. Aquatic animal declines in rivers and lakes: • Sweden has 3000 to 4000 dead lakes. Lakes without fish, frogs, or lily pads. Acidification can cause toxic metals to be leached from sediments in lakes into the water. Similar risks for lakes in the Adirondacks. • Depends on the presence or absence of buffering agents in the bedrock surrounding or underlying lakes - carbonates.
Politics of Acid Deposition • Regional issues. Pollution in Sweden is from other European countries. Similarly, pollution from Illinois, Indiana, Missouri, West Virginia, Ohio, Penn causes acid deposition in New England and Canada.
Controlling Acid Deposition Reduction of emissions (e.g., Clean Air Act of 1990) Conversion of sulfur and nitrogen oxides into acids is also affected by availability of ozone and other emissions which help cause the chemical reactions..
Almost 15% of the world's reefs are already beyond repair thanks to global warming, according to an AAAS report. Another 30% may be lost over the next 30 years. Global warming is harming coral reefs in at least three ways. Changes of just 1 or 2 °C can stifle the life-giving algae. Spiraling levels of carbon dioxide, a greenhouse gas, dissolve in sea water, creating an acidic cocktail that stops polyps oozing their skeleton. And warmer water makes the reef more vulnerable threats, such as overfishing, diseases and pollutants that drain into coastal waters.