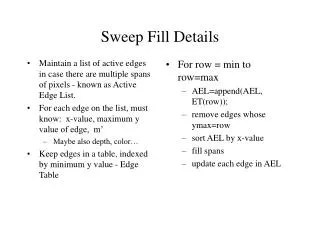
Sweep Overview
Sweep Overview. Mark Ortel Sales Support Eng. Conditioning the Network for Triple Play Services. Know Your HFC Network System Sweep and Ingress Suppression Testing and Hardening the Drop (Home Wiring) Line Conditioning to Optimize Two-way Plant Performance Fiber Optic Testing Maintenance.


Sweep Overview
E N D
Presentation Transcript
Sweep Overview Mark Ortel Sales Support Eng
Conditioning the Network for Triple Play Services • Know Your HFC Network • System Sweep and Ingress Suppression • Testing and Hardening the Drop (Home Wiring) • Line Conditioning to Optimize Two-way Plant Performance • Fiber Optic Testing Maintenance
Bandwidth Demand is Growing Exponentially All Video on Demand Unicast per Subscriber 100 90 High Definition Video on Demand 80 Video Blogs 70 Podcasting 60 Megabits per Second Video on Demand 50 Video Mail 40 Online Gaming 30 Digital Photos 20 VoIP Digital Music 10 Web Browsing E-mail Time
Voice Quality Impairments – it’s not always the plant! Telco Problem? Customer Problem? Cable Provider Problem? Cable Provider Problem? Where is the Problem? What is the Problem? PSTN analog problems on PSTN path passed through to IP network MEDIA GW POP DSP codec performance, echo canceller config., jitter buffer config. / packet drops CORE IP NTWK High utilization lead to congestion causing jitter, dropped packets and increased transit delay, mis-configured routing can cause inappropriate hops leading to increased latency HUB SITE Excessive NE polling and/or high utilization lead to congestion causing jitter, dropped packets and increased transit delay HUB SITE CABLE PLANT RF downstream and/or upstream errors leading to IP packet loss, bandwidth capacity limitations (esp. upstream) may lead to CMTS congestion (dropped IP packets) and excessive jitter (packet drops by codec) HOME Background noise, handset speaker/mic interference, inadequate volume, inside wiring, mis-configured MTA (CoS-Diffserv / firewall settings), wireless phone delay exacerbates echo problems, MTA DSP/echo canceller performance Router-Slot-Port? LSP/VLAN, Route? What’s the problem? MEDIA POP Aggregation switch CMTS Cable MediaGW-Slot-Port? DSP Card-Port-CPU? What’s the problem? CMTS PSTN Trunk Media Gateway Core IP Network CMTS UPSTREAM or DOWNSTREAM? What’s the problem? CMTS-Blade-Port or Switch-Slot-Port? What’s the problem? MEDIA POP MTA Cable Modem POTS Phone Trunk Media Gateway
‘Pre-HFC’ Networks • No Optics • Standardized ‘Tree & Branch’ Architecture • Few Amplifier Types • Limited Operating Levels Networks were optimized for forward plant performance with minimal reverse plant engineering.
‘Pre-HFC’ Networks Headend • No Optics • Standardized ‘Tree & Branch’ Architecture • Few Amplifier Types • Limited Operating Levels Networks were optimized for forward plant performance with minimal reverse plant engineering.
HFC Networks • Combines fiber optics with coaxial distribution network • Return path is more sensitive than the forward path • Most of the ingress comes from home wiring on low value taps • Wide variety of hardware with many connectors Today’s ‘HFC” networks must be optimized for both forward and reverse performance
NODE HFC Network Architecture
NODE HFC Network Architecture
Upstream 3 Basic DOCSIS® Network Downstream Laser and Upstream Optical Receivers CMTS Fiber Nodes Cable Modems Downstream 0 Upstream 0 Cable Modems Upstream 1 Cable Modems Upstream 2 Cable Modems Coax Fiber Coax
Types of Lasers used in HFC Networks • Fabry-Pérot (FP) • Less Expensive • Mediocre Performance • No Isolation or Cooling Required • Distributed Feedback (DFB) • Expensive • High Performance • Isolation and Cooling Required
Forward System • Diverging System • Constant Outputs with Variable Inputs • Fixed Signals • video / audio / digital carriers • System Noise • is the sum of cascaded amplifiers • Balance or Align (Sweep) • compensate for losses before the amp
Forward Path Unity Gain OUT +36 dBmV IN +11 dBmV OUT +36 dBmV IN +12 dBmV OUT +36 dBmV 2 dB 23 dB @ 750 MHz 24 dB @ 750 MHz 8 dB AMP # 2 AMP # 1 AMP # 3 18 dB @ 750 MHz IN +10 dBmV AMP # 4 OUT +36 dBmV
Reverse System • Converging System • Constant Inputs with Variable Outputs • No Fixed Signals • impulse digital carriers • System Noise • is the sum of all active components • Balance or Align (Sweep) • compensate for losses after the amp
Return Path Unity Gain IN +20 dBmV OUT +26 dBmV IN +20 dBmV OUT +24 dBmV IN +20 dBmV 2 dB 4 dB @ 40 MHz 4 dB @ 40 MHz 8 dB AMP # 2 AMP # 1 AMP # 3 2 dB @ 40 MHz OUT +30 dBmV AMP # 4 IN +20 dBmV
Reverse Path Impairments • Ingress and electrical noise • Common Path Distortion (CPD) • Thermal (intrinsic) noise • Laser clipping noise • Micro-Reflections
Reverse Path Impairments There are a variety of impairments that can affect two-way operation. They are classified in three main categories: stationary impairments, which include thermal noise, intermodulation distortion,and frequency response problems; transient impairments, which include RF ingress, impulse noise, and signal clipping; and multiplicative impairments, which include transient hum modulation and intermittent connections.
Reverse Path Impairments Thermal noise —The majority of thermal noise is generated in active components. Besides choosing active equipment with a relatively low noise figure, there is little else that you can do about the thermal noise in active devices, other than ensure proper network alignment.
Reverse Path Impairments Intermodulation distortion—The most common types of intermodulation distortion affecting the reverse path are second and third order distortions. These can be generated in amplifiers and reverse lasers. A more troubling type of intermodulation can occur in some passive components. It is known as common path distortion (CPD), and usually occurs at a dissimilar metals interface where a thin oxide layer has formed.
Reverse Path Impairments Frequency response— Frequency response problems are due to improper network alignment, unterminated lines, or damaged components. When reverse frequency response and equipment alignment have been done incorrectly or not at all, the result can be excessive thermal noise, distortions, and group delay errors.
Reverse Path Impairments RF ingress — The 5-40 MHz reverse spectrum is shared with numerous over-the-air users. Signals in the over-the-air environment include high power shortwave broadcasts, amateur radio, citizens band, government, and other two-way radio communications.
Downstream and Upstream Noise Additions Headend Headend Ingress from seven amplifiers ends up at the headend. Reverse System “Noise Funneling” Forward Signals Noise Noise
Reverse Path Impairments Impulse noise —Most reverse data transmission errors have been found to be caused by bursts of impulse noise. Impulse noise is characterized by its fast risetime and short duration. Common sources include vehicle ignitions, neon signs, static from lightning, power line switching transients, electric motors, electronic switches, and household appliances.
Sample: “Loose Plant” Performance History • Average noise floor at 17 MHz varies consistently by time of day • Indication of return path with an ingress problem. • Maintenance now will prevent future problems 7:00AM 11:00PM 11:00PM 7:00AM Single Frequency Time Window for 72 Hours from one return path
Sample: ‘Tight’ Performance History • 17 MHz noise floor tracked over time • Average noise floor stays fairly flat and consistent over the 3 day period Inconsistent Problem (high peak, low average) Peak Average Minimum Single Frequency Time Window for 72 Hours from one return path
Sample: “Telephony” Performance History • Average telephony signal at 36 MHz varies consistently by time of day • Indication of higher telephony usage times 7:00AM 11:00PM 11:00PM 7:00AM Single Frequency Time Window for 3 days from one return path
Reverse Path Impairments Signal clipping —RF ingress and impulse noise can cause signal clipping, or compression, in reverse plant active components. Excessive levels from in-home devices such as pay-per-view converters also can cause clipping. Clipping occurs in reverse amplifiers and optical equipment.
Ingress • 75 – 90% of ingress originates in the subscriber’s home • To minimize the effects of ingress, operate the subscriber terminals (modems & set-tops) near maximum transmit level
Common Path Distortion (A.K.A. CPD) • Non-linear mixing from a diode junction • Corrosion (metal oxide build-up) in the coaxial portion of the HFC network • Dissimilar metal contacts • 4 main groups of metals • Magnesium and its alloys • Cadmium, Zinc, Aluminum and its alloys • Iron, Lead, Tin, & alloys (except stainless steel) • Copper, Chromium, Nickel, Silver, Gold, Platinum, Titanium, Cobalt, Stainless Steel, and Graphite • Second and third order distortions
Common Path Distortion (A.K.A. CPD) CPD distortions are spaced at 6 MHz apart from each other starting at 6 MHz 24 MHz
DOCSIS® Modem Carrier Wide band noise beyond 42 MHz diplex roll-off Diplex roll-off above 42 MHz 24 Hour Performance History Max Hold Detail Graph
Thermal Noise and Laser Noise • Maintain a tight control of reverse RF signal levels • Laser drive level too high • causes excessive laser clipping • Laser drive level too low • reduces C/N and C/I ratios Reverse levels must be held to a relatively narrow ‘window’ in order to guarantee that they fall comfortably between a lower limit (imposed by the noise floor) and a higher limit (set by laser clipping noise)
Micro-reflections Causes: • Damaged or missing end-of-line terminators • Damaged or missing chassis terminators on directional coupler, splitter, or multiple-output amplifier unused ports • Loose center conductor seizure screws • Unused tap ports not terminated; this is especially critical on low value taps, but all unused tap ports should be terminated with 75-ohm terminations (locking terminators without resistors or stingers do not terminate the tap port) • Poor isolation in splitters, taps and directional couplers • Unused customer premises splitter and directional coupler ports not terminated • Use of so-called self-terminating taps at feeder ends-of-line; these are the equivalent of splitters, and do not terminate the feeder cable unless all tap ports are terminated • Kinked or damaged cable (includes cracked cable, which causes a reflection and ingress) • Defective or damaged actives or passives (water-damaged, water-filled, cold solder joint, corrosion, loose circuit board screws, etc.) • Cable-ready TVs and VCRs connected directly to the drop (return loss on most cable-ready devices is poor) • Some traps and filters have been found to have poor return loss in the upstream, especially those used for data-only service RON HRANAC rhranacj@cisco.com
Why Go Digital? • Efficiency • Source signals are digital • Standard and High Definition TV (SDTV, HDTV) • High Speed Data and Digital Video is more efficient than analog • Transmit equivalent of 6 to 10 analog channels (VCR quality) or 2 HDTV programs over one 6 MHz bandwidth • Quality • Better Picture and Sound Quality • Less Susceptible to noise • Error detection and correction is possible • Flexibility • Data-casting easily multiplexed into digital signal • Higher Data Security
What is Digital? • Source and Destination is digital data • Assign unique patterns of 1’s and 0’s • Transmission path is via an analog QAM carrier • Choice of modulation is the one that optimizes bandwidth (data versus frequency ‘space’) and resiliency to noise 01 00 10 11 01 00 10 11 Generate Digital Receive Digital QAM Analog Carrier
Quadrature Amplitude Modulation (QAM) • QAM combines QPSK and AM modulation. • QAM uses 2 channels of information each carrying half the data. I Channel AM Modulator Carrier Bit Stream 10 11 Combiner Carrier + 90° AM Modulator Q Channel
Vector Sum of I and Q Channels • Combining 2 carriers 90° of out of phase results in a carrier with amplitude and phase modulation 4 Levels of Q 01 00 10 11 4 Levels of I Channel + ..10 11.. = Data Stream 4 Levels of I 00 01 4 Levels of Q Channel ..10 11.. 10 16 QAM 11
Constellations, Symbols and Digital Bits • Each “dot” on constellation represents a unique symbol • Each unique symbol represents unique digital bits • Digital data is parsed into data lengths that encode the symbol waveform 4 Levels of Q Channel 4 Levels of I Channel 16 QAM
64 QAM and 256 QAM • 64 QAM has 8 levels of I and 8 levels of Q making 64 possible locations for the carrier • 256 QAM has 16 levels of I and 16 levels of Q making 256 possible locations for the carrier 16 Levels of Q Channel 8 Levels of Q Channel 8 Levels of I Channel 16 Levels of I Channel 64 QAM 256 QAM
QAM and CATV • 16 QAM is part of the DOCSIS® 1.0/1.1 upstream specifications • 64 QAM and 256 QAM is used for both digital video and DOCSIS downstream, allowing more digital data transmission using the same 6 MHz bandwidth • Transmit equivalent of 10 to 12 analog channels (standard definition) or 2 HDTV programs over one 6 MHz bandwidth • Standard for data over Cable • Cable systems provide higher signal to noise ratios than over-the-air transmission. A well designed and maintained cable plant meets these QAM signal to noise requirements
Constellation Display The constellation is a visual representation of the I and Q plots
Effects of Noise and Interference Ideal Locations Noise and Interference moves the carrier away from its ideal location causing a spreading of the cluster of dots.
Modulation Error Ratio (MER) • Analogous to S/N or C/N • A measure of how tightly symbols are recorded with respect to desired symbol location • MER(dB) = 20 x log RMS error magnitude average symbol magnitude • Good MER • 64 QAM: 28 dB MER • 256 QAM: 32 dB MER Average symbol magnitude RMS error magnitude
Constellation Zoom • Zooming in on the constellation you can see how the carrier spread and how close it came to the decision boundaries. Decision Boundaries
The Carrier, by the way, is ANALOG Modulation Analog Content – Analog Carrier Digital Content – Analog Carrier
PathTrak QAM Analyzer View – Good Node MER & Level Avg/Max/Min MER & Level Graphed over Time QPSK & 16QAM Constellation Live MER, Level & Symbol Count