Download
1 / 34
340 likes | 416 Views
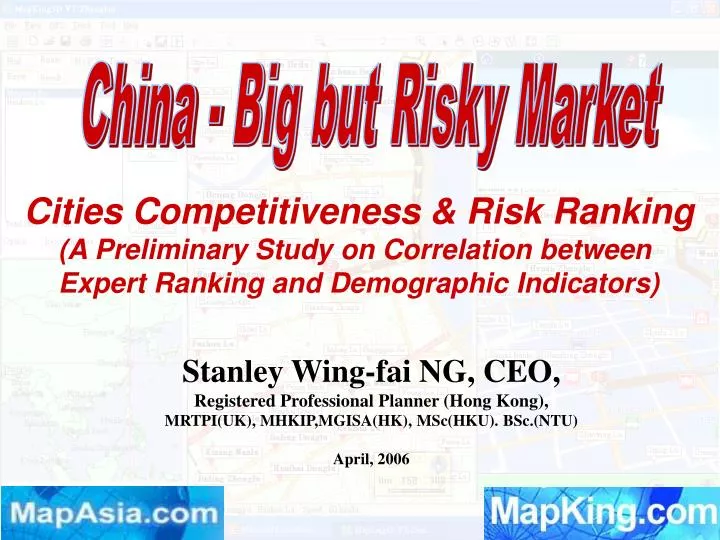
China - Big but Risky Market. Cities Competitiveness & Risk Ranking (A Preliminary Study on Correlation between Expert Ranking and Demographic Indicators). Stanley Wing-fai NG, CEO, Registered Professional Planner (Hong Kong), MRTPI(UK), MHKIP,MGISA(HK), MSc(HKU). BSc.(NTU) April, 2006.

E N D
China - Big but Risky Market Cities Competitiveness & Risk Ranking (A Preliminary Study on Correlation between Expert Ranking and Demographic Indicators) Stanley Wing-fai NG, CEO, Registered Professional Planner (Hong Kong), MRTPI(UK), MHKIP,MGISA(HK), MSc(HKU). BSc.(NTU) April, 2006
Market,Resources Local Gov Sch. Relations Other Factors Cities/ Counties Based Investment Decisions • Statistics and Census • Demographic • Economic Indicators • Personnel Indicators • 2300+ Cities/ Counties Input 2 Database • Input 1 • Expert Ranking • System • Competitiveness • Investment Index • Empirical • 50-108 cities/ ind. zones Correlation Analysis General Rules Branch/ Factory/ Outlet Decision
Several Taiwan scholars’ Studies for Trade Associations “Analysis on Competitiveness and Risks for China Cities” 2001-2004 published Survey and Expert Ranking System Questionnaire Survey Focus Group Case Studies, Factory Visits Publication Ref: “兩力兩度見商機 – 2004中國大陸地區投資環境與風險調查” Author: Taiwan Electrical and Electronic Manufacturers’ Association台灣區電機電子工業同業公會, ISBN:986-7877-12-8, 2004.主任委員:焦佑君,主持:呂鴻德,協同主持:黃銘章,顧問:高孔廉 生產力中心 China Productivity Center (Taiwan), “進軍中國大陸市場機遇與挑戰”,外貿協會 Taiwan External Trade Development Council Input 1: Expert Ranking SystemCities’ Competitiveness & Risks
Index Derived • Ranking in Competitiveness – 108 cities • Major Cities and Counties include 108 major cities, industrial zones, Special Economic Region • Competitive power is calculated by: infrastructure, finance status, investment environment, economic status and employment. • Ranking in Overall Investment Index – 41 cities • Investment Risks • Local Governance Risks, Environmental Risks, Social Risks etc • Investment Index is calculated by the • Competitive Power, • Investment environment, • Investment riskof a city.
Expert Ranking:- • Empirical data from case studies • Case studies, interview, survey • In-depth case studies of Taiwanese factories/ investors • 108 cities/ counties/ industrial zones ranked depends on cases and data readiness • Not applicable to cities/ counties not ranked • about 100 cities out of 2300+ cities/ counties • General limitation of expert ranking system • personal factors • different scale/ parameters
Census & Statistics Data in China – 2300+ Cities Data Availabilities USA/ UK /HK system vs. China system national data vs. local data Data reliabilities, personnel vs. government corporate Data Release Time Frame 2005, national and provincial data 2004, cities/ counties and districts inside cities 2003, cities/ counties and districts rectified in 2005 Input 2: Census & Statistics DataDemographics and Economy
CHINA infoMap Jointly developed by ACMR and MapAsia Demographics and Statistics for 2300+ Cities
Regression Analysis ANOVA Analysis (Analysis of Variance) Map Overlay Analysis Parameters Competitiveness and Investment Index Variables in wages, population, GDP, Education Attainment, Industrial Output Compare Expert Ranking with Statistics
China Census data 2003 was used. (2003 data rectified in 2005) Factors for the calculation: Wages, GDP, Population, Industry and Education “Factors” against Competitive Power “Factors” against Investment Index Basic Information
Calculated by: infrastructure, financial status, investment environment, economic status and employment of a City. Parameters against Competitive Power Wages- total wages of the city, Million RMB GDP – Million RMB Population – Million Education – High school student, Middle school student in million Industry Output Million 108 Cities included in the Expert Ranking System Competitive Power
Calculated by the competitive power, investment environment and investment risk Parameters in Wages, population, GDP, Education and Industrial Output against Investment Index 41 Cities included in the Expert Ranking System Investment Index
Preliminary Findings:- 1. Expert Ranking of Competitiveness positive correlate with some major demographic indicators, i.e. GDP, per capital GDP, output of secondary industries, wages 2. Correlation of Experts’ Investment Index (include Risks Index) not so significant.
GDP, per capita GDP, Industrial Output and Wages having higher correlation with Competitive Power among other factors Population and Education Attainment having lower correlation with Competitive Power among the factors. For the Investment Index, none of the factors obtain a significant correlation with investment index. For further analysis, time series analysis may improve the predictive model of the competitive power and Investment Index.
Thank You • Stanley Ng (CEO), stanley@mapasia.com • Team member: • Stanley NG, CEO • Winsome Wong, GIS Specialist • Ng Wing Yiu, Data Manager • MapAsia.com • City Country Consultancy Ltd • Hong Kong . China . Kuala Lumpur . Singapore • mapsale@mapasia.com, 852-27409680,