Download
1 / 58
580 likes | 727 Views
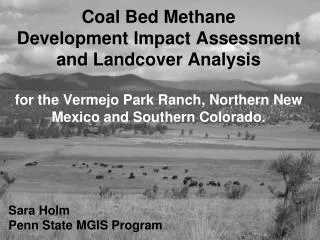
Coal Bed Methane Development Impact Assessment and Landcover Analysis for the Vermejo Park Ranch, Northern New Mexico and Southern Colorado. Sara Holm Penn State MGIS Program. Vermejo Park Ranch Location Map. 584,000 acres Taos & Colfax Counties, NM Costilla & Las Animas Counties, CO

E N D
Coal Bed Methane Development Impact Assessment and Landcover Analysisfor the Vermejo Park Ranch, Northern New Mexico and Southern Colorado. Sara Holm Penn State MGIS Program
Vermejo Park RanchLocation Map • 584,000 acres • Taos & Colfax Counties, NM • Costilla & Las Animas Counties, CO • 5,850’-12,920’ elevation
Vermejo Park Ranch Mission Statement: “to manage Turner lands in an economically sustainable and ecologically sensitive manner while promoting the conservation of native species." • Working Bison Ranch • Guest Ranch for Hunting and Fishing • Coal Bed Methane (CBM) Development Monitoring Program • Forest Thinning Projects & Wildland Fire Management North American Bison, VPR
Project Goals • Create a Landcover Analysis to assist forest thinning operations, wildland fire management, and habitat estimation. • Create a CBM Impact Analysis to quantify effects of CBM development on the landscape. • Integrate analyses into existing ranch enterprise GIS to aid in ranch management.
1995-97 DOQQ 2005 Satellite Imagery 60cm, 4 color, 1:12,000 NMAS
Forest Thinning Program • Areas of the ranch were heavily logged during previous ownerships. • As result of logging, forests grew back too densely. • Forestry department implemented thinning operations to restore forests to a healthy tree spacing. • Thinned areas aid in wildland fire management Thinned Non-thinned
Designated Landcover Types:Forested • Aspen • Cottonwood • Mixed Conifer: Ponderosa Pine, Douglas Fir, White Fir • Oak: Gamble Oak, Mountain Mahogany • Piñon-Juniper • Ponderosa Pine • Riparian Shrubs: Willows, Locust • Spruce-Fir: Englemann Spruce, Subalpine Fir
Designated Landcover Types:Non-Forested • Barren Ground • Road: Accessible human disturbance • Prairie Grass • Riparian Grass • Upland Grass • Water
Forestry Land Cover Analysis Created a landcover grid from 2005 satellite imagery : • Land cover analysis utilized a 1000m (1km) spacing of points (2366 point features). • Determination of attributes for each point location included slope, aspect, elevation, access, species cover type, cover density, patch size, and tree size where applicable. • Selected points were field checked for cover accuracy and digital photos linked to point data. • Manageable thinning attribute was calculated.
Landcover Attributes • Slope: ‘extract to point’ from 10m DEM and 20 acre mean slope using zonal statistics • Aspect and elevation: ‘extract to point’ from 10m DEM • Access: combination of road availability and topography • Species cover type: species at point on imagery if patch exceeds minimum of 10 acres • Cover density: low, medium or high • Patch size: 10, 25, 50 … >= 200 acres using 25 acre grid overlay • Tree size: regrowth (<6”), pole (6-12”), saw log (>=12”) diameter
Field Verification/Photos Piñon-Juniper • 71 of 2366 points located using GPS unit (3%) • Field checks still in progress • Digital photos of locations taken with 12” square marker • Photo files linked to point features • Currently 99% accuracy rate for cover type attribute
Landcover Analysis Results:Cover Types by Percent • Ponderosa Pine: 31.74% • Mixed Conifer: 15.89% • Piñon-Juniper: 11.92% • Oak: 10.44% • Prairie Grass: 10.31% • Upland Grass: 7.86% • Spruce-Fir: 5.07% • Riparian Grass: 2.41% • Aspen: 1.86% • Roads: 1.18% • Barren Ground: 0.72% • Water: 0.38% • Cottonwood: 0.17% • Riparian Shrub: 0.05% Ponderosa Pine
Cover Types by Estimated Acreage Mixed Conifer Ponderosa Pine: 185,350 acres Mixed Conifer: 92,799 acres Piñon-Juniper: 69,599 acres Oak: 60,961 acres Prairie Grass: 60,220 acres Upland Grass: 45,906 acres Spruce-Fir: 29,617 acres Riparian Grass: 14,068 acres Aspen: 10,859 acres Roads: 6,911 acres Barren Ground: 4,196 acres Water: 2,221 acres Cottonwood: 987 acres Riparian Shrub: 247 acres
Manageable Thinning Attribute “Manageable” locations were selected using the following query parameters : • Slope<50% (using 20 acre buffer mean slope) • Patch Size >= 100 acres • Cover Density = Medium or High • Cover Type = Ponderosa Pine, Piñon-Juniper, Aspen, Spruce-Fir, or Mixed Conifer • Access = Road in patch or available from nearby patch
CBM Development Impact Assessment CBM Well Pad, VPR
Coal Bed Methane (CBM) CBM Well Location • A portion of the Vermejo Park Ranch is being developed by mineral rights owner, El Paso Energy for methane gas production. • Methane gas wells extract gas from subsurface coal seams. • Water produced to release gas from the coals flows by pipeline to facilities where the water is re-injected into lower stratigraphic units. • Produced gas is pressurized by compressor facilities and sent via underground pipelines to sales as “natural gas”. Compressor Facility
CBM Disturbance Types • Roads with adjacent pipeline and cable • High and Low Pressure Pipeline Corridors • METL (Overhead Electric Lines) Corridors • Facility Sites (Compressors, Injection Sites, Staging Areas) • Well Locations (Pads)
CBM Project Area At time of Fall 2005 imagery acquisition: • Project consisted of 634 well locations • Well spacing is 160 acres • Approximate Total Impacted Area: 634x160=101,440 acres
Creating CBM Disturbance Polygons • Roads with adjacent pipeline: existing GPS’ed line feature buffered by width attribute • Low and High Pressure Pipeline Corridors: existing GPS’ed line feature buffered by width attribute • Main Electric Transmission Lines (METL): existing GPS’ed line feature buffered by width attribute • Well Locations or Pads: polygon feature digitized from 2005 imagery • Main Facilities (Compressors, Water Injection sites, Staging Areas): polygon features digitized from 2005 imagery
Disturbance Width Attributes • Roads: 22’, 24’, or 34’ depending on year constructed • Low Pressure Pipeline Corridors: 24’ or 34’ based on location • METL Corridor: 50’ • High Pressure Pipeline Corridors: 40’
Eliminating Overlapping Disturbance Polygon overlaps eliminated Hierarchy: 1. Well Pads 2. Facility Sites 3. High Pressure Pipe 4. METL 5. Low Pressure Pipe 6. Roads
New vs. Pre-CBM Disturbance • Pre-CBM disturbance used when possible for CBM development • CBM disturbance features were designated as New or Pre-CBM (existing) • Utilized pre-CBM DOQQ • Pre-CBM road width:16 feet
Linear Distances for CBM Roads At time of fall 2005 imagery acquisition: • 417 miles of CBM roads • 180 miles of Pre-CBM ranch roads were used • 237 miles of new CBM roads were constructed
Total Pre-CBM Disturbance Area Utilized: 406 acres Roads: 340 acres Well Locations: 0 acres METL: 11 acres HP Corridors: 33 acres LP Corridors: 22 acres Facility Sites: 0 acres Total New Construction Disturbance Area: 2279 acres Roads: 1,406 acres Well Locations: 380 acres METL: 185 acres HP Corridors: 158 acres LP Corridors: 114 acres Facility Sites: 36 acres Pre-CBM Disturbance Areas Utilized and New Construction
Total CBM Disturbance Area: 2,685 acres Roads: 1,747 acres Well Locations: 380 acres METL: 195 acres HP Corridors: 191 acres LP Corridors: 135 acres Facility Sites: 36 acres Pre-CBM/Total CBM Disturbance Area: 15% Roads: 19% Well Locations: 0% METL: 5% HP Corridors: 17% LP Corridors: 16% Facility Sites: 0% Total CBM Disturbance Area and Percent Pre-CBM Disturbance Utilized
Analysis of Disturbance of Landcover Types • Cover types data from 1 km landcover grid • Recalculated landcover grid in Spatial Analyst • Individual disturbance type and total disturbance polygons set as analysis mask • Only cover types within disturbance polygons retained in new grids • Calculated percent total for each resulting grid by disturbance type and total disturbance
Cover Types Disturbed by Well Locations Cover: %Total: Normalized* Water: 0.15%: -0.23% Riparian Grass: 0.82%: -1.59% Road: 3.53%: 2.35% Piñon-Juniper: 5.05%: -6.87% Upland Grass: 6.44%: -1.42% Ponderosa: 47.25%: 15.51% Oak: 9.49%: -0.95% Mixed Conifer: 27.26%: 11.37% *Normalized= %Total - Total Ranch Cover %
Cover Types Disturbed by Facility Sites Cover: %Total: Normalized Riparian Grass: 8.17%: 5.76% Road: 10.89%: 9.71% Piñon-Juniper: 8.73%: -3.19% Upland Grass: 7.89%: 0.03% Ponderosa: 34.85%: 3.11% Oak: 1.33%: -9.11% Mixed Conifer: 28.14%: 12.25%
Cover Types Disturbed by METL Cover: %Total: Normalized • Riparian Grass: 1.77%: -0.64% • Road: 4.78%: 3.60% • Piñon-Juniper: 12.10%: 0.18% • Upland Grass: 10.45%: 2.59% • Ponderosa: 50.02%: 18.28% • Oak: 7.23%: -3.21% • Mixed Conifer: 13.64%: -2.25%
Cover Types Disturbed by High Pressure Pipeline Corridors Cover: %Total: Normalized • Water: 1.94%: 1.56% • Riparian Grass: 4.47%: 2.06% • Road: 5.92%: 4.74% • Piñon-Juniper: 16.53%: 4.61% • Upland Grass: 5.16%: -2.70% • Ponderosa: 32.88%: 1.13% • Oak: 13.70%: 3.26% • Mixed Conifer: 19.41%: 3.51%
Cover Types Disturbed by Low Pressure Pipe Corridors Cover: %Total: Normalized • Riparian Grass: 3.66%: 1.25% • Road: 6.48%: 5.29% • Piñon-Juniper: 3.24%: -8.68% • Upland Grass: 14.68%: 6.82% • Ponderosa: 50.48%: 18.44% • Oak: 1.33%: -9.11% • Mixed Conifer: 20.25%: 4.36% • Aspen 0.18% -1.68%
Cover Types Disturbed by Roads Cover: %Total: Normalized • Water: 0.69%: 0.31% • Riparian Grass: 1.35%: -1.06% • Road: 3.64%: 2.46% • Piñon-Juniper: 5.28%: -6.64% • Upland Grass: 8.24%: 0.38% • Ponderosa: 49.33%: 17.59% • Oak: 7.46%: -2.98% • Mixed Conifer: 24.01%: 8.11%
Cover Type Disturbed by Total CBM Disturbance Cover: %Total: Normalized • Water: 0.60%: 0.22% • Riparian Grass: 1.72%: -0.69% • Road: 4.08%: 2.90% • Piñon-Juniper: 6.46%: -5.46% • Upland Grass: 8.18%: 0.32% • Ponderosa: 47.95%: 16.21% • Oak: 7.76%: -2.68% • Mixed Conifer: 23.23%: 7.33% • Aspen 0.01% -1.85%
Patch Fragmentation Analysis • Landscapes comprised of patches and corridors • Human activities, i.e. road building, tend to straighten patch edges • Elk and deer tend to cross or enter curved boundaries and travel parallel to straight edges • Will patch analysis indicate that CBM disturbance has simplified patch edges?
Creating Landscape Patches • Patches defined by cover type vs. habitat patches • Disturbance corridors defined as background • 1996 cover type patches digitized from DOQQ using landcover analysis points • 2005 patches created by removing total CBM disturbance polygons from 1996 patch polygons • Patch change limited to CBM disturbance
Preparation for FRAGSTATS • FRAGSTATS 3.3: standard landscape ecology fragmentation software • Created grids from 1996 and 2005 polygons in Spatial Analyst • Calculated grid*(-1) to created signed integer file in raster calculator • Reclassified grid values within landscape to be positive leaving negative border background area to retain signed integer grid format • Converted grids to ASCII format • Built class properties text file
FRAGSTATS Structural Patch Metrics • Area: Area of individual patches • Perimeter: Patch edge measurement • Perimeter to Area Ratio (PARA): Complexity of patch shape or edge • Fractal Dimension Index (FRAC): Complexity of the patch shape or edge • Related Circumscribing Circle (CIRCLE): How patch compares to a true circle • Shape Index (SHAPE): Compact vs. Irregular patch shape Negative values for metrics 3-6 indicate simplification.
Selected Patch Change Study Areas 9 square kilometer areas: • High Disturbance Area: surrounding central facility site including all disturbance types • Medium Disturbance Area: incorporating small facility site, well locations and roads • Low Disturbance Area: adjacent to and includes sensitive area (non-drillable) with nearby well locations and roads only
Landscape 1-High Mean Values of Metric Results: • Area 1996: 6.01 hectares • Area 2005: 2.66 hectares (-) • Perimeter 1996: 1557.62 m • Perimeter 2005: 794.67 m (-) • PARA 1996: 1960.17 m/m^2 • PARA 2005: 5218.57 m/m^2 (+) • FRAC 1996: 1.140 • FRAC 2005: 1.140 (no change) • SHAPE 1996: 2.014 • SHAPE 2005: 1.762 (-) • CIRCLE 1996: 0.69 • CIRCLE 2005: 0.66 (-) Number of Patches increased from 148 to 325
Landscape 2-Medium Mean Values of Metric Results: • Area 1996: 13.784 hectares • Area 2005: 10.509 hectares (-) • Perimeter 1996: 2528.738 m • Perimeter 2005: 2218.381 m (-) • PARA 1996: 1147.098 m/m^2 • PARA 2005: 1907.466 m/m^2 (+) • FRAC 1996: 1.133 • FRAC 2005: 1.129 (-) • SHAPE 1996: 2.085 • SHAPE 2005: 2.023 (-) • CIRCLE 1996: 0.731 • CIRCLE 2005: 0.723 (-) Number of Patches increased from 65 to 84
Landscape 3-Low Mean Values of Metric Results: • Area 1996: 11.015 hectares • Area 2005: 9.709 hectares (-) • Perimeter 1996: 2471.16 m • Perimeter 2005: 2330.68 m (-) • PARA 1996: 1755.17 m/m^2 • PARA 2005: 1617.57 m/m^2 (-) • FRAC 1996: 1.140 • FRAC 2005: 1.145 (+) • SHAPE 1996: 2.212 • SHAPE 2005: 2.197 (-) • CIRCLE 1996: 0.715 • CIRCLE 2005: 0.723 (+) Number of Patches increased from 81 to 91