Download
1 / 1
10 likes | 92 Views
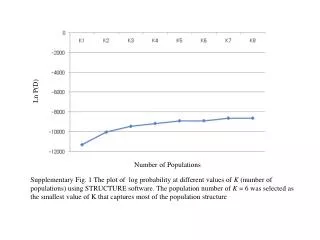
Analysis of log probability at various K values in STRUCTURE software. K=6 was optimal for capturing population structure effectively.

E N D
Ln P(D) Number of Populations Supplementary Fig. 1 The plot of log probability at different values of K (number of populations) using STRUCTURE software. The population number of K = 6 was selected as the smallest value of K that captures most of the population structure