Download

1 / 48
580 likes | 1.11k Views
Cerebral Blood Flow -Regulation -Measurement of CBF & CMR. Dr. Shikha Rao. University College of Medical Sciences & GTB Hospital, Delhi. Relevant cerebrovascular anatomy. Anterior circulation Posterior circulation

E N D
Cerebral Blood Flow-Regulation-Measurement of CBF & CMR Dr. Shikha Rao University College of Medical Sciences & GTB Hospital, Delhi
Relevant cerebrovascular anatomy • Anterior circulation • Posterior circulation • Collateral arterial inflow channels –cornerstone of CBF compensation during ischemia. - Pial to pial anastomosis Circle of willis
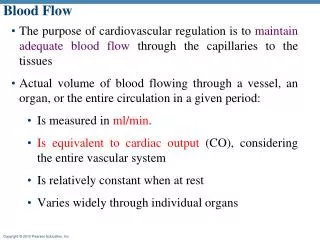
Cerebral Blood Flow • BRAIN 1350 gm- 2% of total adult body wt • Receives 12 to 15 % of cardiac output • Global cerebral blood flow - 45 – 55ml/100 gm / min Cortical Subcortical 75-80ml /100gm/min 20ml /100gm/min
CBF term neonate -100ml/100gm/min preterm infant -30-40ml/100gm/min • CMRO2 – 3 to 3.5 ml/100gm/min • Whole brain O2 consumption – 47ml/min (20% of total body O2 consumption) • Cerebral glucose utilization - 5.5 gm/100gm of brain tissue • ICP ( supine) -5 to 15 mm hg
Brain Oxygen Requirement 60% Activation metabolism 40% Basal metabolism NEURONAL ACTIVITY CELLULAR INTEGRITY
Energy metabolism in brain NAD ADP NADH ATP NADH NAD Glucose Pyruvate Lactate
M I T O C H O N D R I A CO2 NAD NADH Citric acid cycle ADP NADH O2 Oxidative Phosphorylation ATP NAD H2O
Factors Influencing CBF • Chemical/Metabolic /Humoral • Cerebral metabolic rate • Anaesthetics • Temperature • PaCO2 • PaO2 • Vasoactive drugs - Anaesthetics,Vasodilators, Vasopressors • Myogenic / Autoregulation • Rheologic - Blood viscosity • Neurogenic
Chemical Regulation Cerebral metabolic rate – Flow metabolism coupling Increased neuronal activity Increased local brain metabolism Increased regional blood flow
LOCAL COUPLING OF CMR & CBF METABOLIC VASCULAR FACTORS GLIAL NEURAL
Uptake of glutamate by glial triggers l/t increased glial metabolism & lactate production • Glutamate NO • Nerves innervate cerebral vessels – Peptide Neurotransmitters • VIP • NEUROPEPTIDE Y • SUBSTANCE P
PaCO2 &CBF • CBF varies directly with PaCO2 within its physiologic range of variation • 1 mm Hg PaCO2 CBF 1-2 ml/100gm/min • At PaCO2 < 25 - response attenuated • Alteration in PaCO2 & CBF • pH dependent • alkalosis- vasoconstriction • acidosis-vasodilation • NO & Prostaglandins
Changes in CBF in r/t PaCO2 occur rapidly , but not sustained • CBF returns to normal in 6-8 hrs (CSF pH N extrusion of bicarbonate ) • Acute normalization of PaCO2 will result in significant CSF acidosis (after hypocapnia) or alkalosis (after hypercapnia)
Vasodilatory Cascade • Hypovolemia cardiogenic pharmacologic SABP CPP • CMR • Viscosity • Hypoxia • Hypercapnia Vasodilatation • oedema • CSF ICP CBV
Steal phenomenon Hypoventilation CO2 & pH vasodilatation impeding ability to direct flow to arterioles maximally dilated areas of high metab demand thro’ out brain Inverse steal or Robinhood effect Hyperventilation ( CO2 ) blood flow dec to most areas of brain & inc to thiopental(dec metabolism) ischemic areas
Vasodilatory Cascade • Hypovolemia cardiogenic pharmacologic SABP CPP • CMR • Viscosity • Hypoxia • Hypercapnia Vasodilatation • oedema • CSF ICP CBV
PaO2 • 60 – 300 mmHg – little influence on CBF • <60 mmHg – CBF rapidly increases • Mechanisms mediating cerebral vasodilatation during hypoxia • Neurogenic effects – peripheral chemoreceptors , neuraxial chemoreceptors, local humoral influences • Hyperaemic response to hypoxia mediated by NO of neuronal origin • Hypoxia induced hyperpolarization of vascular smooth muscle by the opening of ATP dependent k+ channels • Stimulation of Rostral Ventromedulla (RVM / O2 SENSOR ) by hypoxia increases CBF (not CMR) • Response to hypoxia synergistic with hyperemia produced by hypercapnia or acidosis
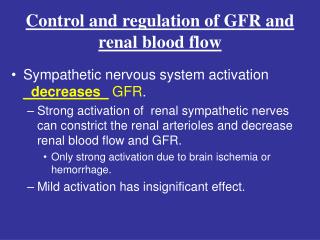
Myogenic (autoregulation) • Cerebral autoregulation – ability to maintain a relatively constant organ bld flow over a range of perfusion pressure OR Capacity of cerebral circulation to adjust its resistance to maintain a CBF constant over a wide MAP • Autoregulation MAP 70 to 150 mmHg • Below / above 70 -150 CBF becomes pressure passive CBF = CPP/CVR CPP = MAP -ICP
Myogenic Intrinsic response of myogenic smooth muscle in cerebral arterioles to changes in MAP (NO) Autonomic innervation of cerebral blood vessels May also contribute to autoregulation of blood flow Metabolic CMR determines arteriolar tone i.e. when tissue demand exceeds bld flow release of tissue metabolites Vasodilatation CBF Mechanism
Chronic hypertension - shifts Autoregulation curve to right . • Protects the brain against “ breakthrough” by surpassing the upper limit of autoregulation, at expense of lower limit • Symptoms of cerebral hypoxia do not occur even at MAP 35-40 mmHg in normotensives but can appear at a significantly higher BP in chronic hypertensives • Vascular hypertrophy size of intravascular lumen proximal conductance vessel resistance • This increase in resistance is similar to case with acute sympathetic stimulation
Chronic hypertension - shifts Autoregulation curve to right . • Protects the brain against “ breakthrough” by surpassing the upper limit of autoregulation, at expense of lower limit • Symptoms of cerebral hypoxia do not occur even at MAP 35-40 mmHg in normotensives but can appear at a significantly higher BP in chronic hypertensives • Vascular hypertrophy size of intravascular lumen proximal conductance vessel resistance • This increase in resistance is similar to case with acute sympathetic stimulation
Vascular changes & autoregulatory shift induced by chronic HTN is modified by long term anti-HTN therapy, degree of reversal determined by length of t/t • With regard to acute therapy net effect is attributed by combination of predicted fall in CBF d/t autoregulatory failure & the direct pharmacologic effect of the drug on cerebral vasculature • Head trauma, brain lactic acidosis, brain injury – abolish autoregulation • Tumour brain tissue blood flow is not autoregulated • Potent inhaled anaesthetics & hypercarbia abolish autoregulation in a dose dependent manner
Normotensives Cerebral blood flow Hypertensives MAP
Anaesthetic agents • Most anaesthetics – decrease CBF & CMR . • However anaesthetic affects – electrophysiological component, i.e. plasma level beyond what is reqd. to achieve EEG suppression results in no further in CMR Plasma conc. of anaesthetic agents
Temperature • CMR decreases by 6 to 7 % / degree temp. reduction • Hyperthermia • 37 to 42° C CBF & CMR increase • >42°C dramatic reduction in cerebral O2consumption (toxic effect of protein enzyme degradation ) • Note – anaesthetic agents reduce CMR a/w neuronal function but hypothermia decreases rate of energy utilization a/w both electrophysiologic function and basal component of cellular integrity • Mild hypothermia affects the basal component of CMR
Functional states CMR ,sleep , coma CBF CMR, sensory stimulation, CBF epileptic activity
Viscosity • Blood vicosity can influence CBF. • In healthy subjects variation in hematocrit 33 – 45% caused only modest alteration in CBF • Anemia CVR CBF ( viscosity & O2 carrying capacity) Age • Aging from childhood to adulthood is a/w progressive reduction in CBF & CMRO2
Cerebral vasculature is extensively innervated Density of innervation declines with vessel size i.e. greatest neurologic influence appears to be on cerebral arteries Hemorrhagic shock, state of high sympathetic tone results in lower CBF at a given MAP c/t hypotension produced with sympatholytic drugs Neurogenic regulation
Best Estimates of the Influence of Pure Catecholamine Receptor Agonists and Specific Pressor Substances on Cerebral Blood Flow and Cerebral Metabolic Rate
Methods to calculate CBF • Kety-Schimdt’s Arteriovenous Difference • Positron Emission Tomography (PET) • Single Photon Emission Computed Tomography (SPECT) • Magnetic Resonance Imaging (MRI) • Cerebral Optical Infrared Spectroscopy • Transcranial Doppler • Thermal Diffusion • Radioactive Tracer Washout
Kety-Schimdt’s Arteriovenous Difference • Fick ‘s principle: Qb = F. [Ca – Cv] F =Volume of blood flow to tissue Ca –mean concentation of substance in arterial blood Cv= mean concentration in venous blood draining the tissue • Based on Fick’s principle: CBF = CMRO2 / AJDO2 AJDO2 - arteriojugular oxygen difference • Monitoring AVDO2 is of particular relevance in head injury patients in ICU where minute ventilation is adjusted to reduce brain volume because inducing hypocapnia without regard to CBF may adveresly affect outcome.
If CMRO2 is constant, relative changes in A-V difference in O2 content must reflect global CBF, i.e. CBF = a. [Ca – Cv] a is proportionality constant Tracer activity or conc. A freely diffusible tracer is given until equilibrium exists between the Ca and Cv concentrations. The area between the two curves is –proportional to CBF
AJDO2 = CMRO2 / CBF This equation indicative of coupling or lack of coupling b/w flow & metabolism • Normal AJDO2 is 7 ml / 100 ml blood till no change in demand & supply occurs • If • < 4 ml/ 100 ml blood – assumed O2 supply to be excessive • 8- 9 ml/ 100 ml blood – state of compensatory hyperperfusion • >9 ml / 100 ml blood – Impending / actual global ischemia After infarction occurred AJDO2 will decreases
Disadvantages • Cumbersome & invasive • May overestimate the CBF in low perfusion states
Radioactive Tracer Washout • Radiolabelled tracer 85Kr or 131Xe is injected directly into cerebral arterial supply & cerebral washout f/ w external scintillation counters placed over skull • Adv – absolute tracer amt , tissue weight & blood volume not neede for calcuation of CBF • Disadv – Invasive intraarterial carotid artery puncture
Positron Emission Tomography • It relies on detection of high energy gamma ray photons which result from collision b/w positron & electrons • ray detectors – detect and measure emission • Three areas of function that are of Interest to anaesthesiologist- • Possible to examine functional effects of extracranial arterial stenosis on CBF, BV & O2 delivery • Follow development & resolution of ischaemic lesions • Interrelation b/w various anaesthetic agents & indices of cerebral function can be compared
Adv • Precise imaging of CBF, CBV, Cerebral glucose pH & NT events Disadv • Complexity • Radiation exposure
Single Photon Emission Computed Tomography (SPECT) • Image produced by gamma scintilation counters that is reconstructed in 3- d by some form of rotating or moving camera . • Adv • more specific anatomic information • Cheaper than PET • Disdav • Less resolution than PET • Radioactivity
Magnetic Resonance Imaging (MRI) • By using paramagnetic tracers that can be excited in a magnetic field , one may directly examine cerebral perfusion • Information of morphology, physiology & biochemical changes in vivo without use of ionizing radiation • MRI resolution & its ability to corelate BF information with structural information could make this the “GOLD STANDARD“ in years to come
Thermal clearance • Thermal conductivity of cortical tissue varies proportionally with CBF & measurement of thermal gradients at cortical surface can be used for quantitative CBF determination • Adv • Monitors focal cortical blood flow • Continuous quantitative measurement • Disadv • Only local cortical blood flow evaluation
Trans Cranial Doppler • Doppler probe placed over a low density bone regions of skull & beam is focussed on a desired vessel • Doppler shift of ultrasonic beam after its reflection on moving blood column within the vessel is directly proportional to blood flow velocity. • Does not measure CBF but velocity & direction of moving column of blood in a major artery . • Flow determined by F = dv F =bulk flow ml/ min d = diameter of vessel v = velocity
Adv • Relatively inexpensive • Non invasive & non radioactive • Continuous information of CBF Disadv • Cannot measure global CBV & CBF • Difficulty in locating a vessel
Cerebral optical infrared spectroscopy • Absorption & reflectance measurements of incident infrared light can be used to calculate redox state of cytochromes ( to gauge failure of oxidative phosphrylation & hemoglobin ) • Measures cerebral O2 delivery to brain ( by yielding information about cerebral venous O2 saturation ) • Adv Noninvasive Ability to probe tissue at varying depths Ability to repeat measurements at clinically useful intervals • Disadv Validity of regional data information is controversial
Measurement of cerebral metabolic rate • Whole brain estimates of CMR can be obtained from Fick’s equation if CMR & concentrations of tracer in arterial inflow & venous flow are known. • For oxygen CMRO2 = CBF (CaO2 – CvO2) • Kety Schimdt technique can supply values& is used to measure global CMR .
References • Miller’s Anaesthesia, 7th ed. • Wylie and Churchill Davidson’s. 7th ed. • Morgan. Clinical Anaesthesiology, 4th ed. • Cottrell Neuroanaesthesia • Snell’s Textbook of Anatomy