Download
1 / 62
620 likes | 748 Views
This document explores the Three-Tiered Model for Reading Intervention (RTI), an innovative approach for identifying and assisting students struggling with reading. It emphasizes a systematic method of assessing student progress and providing tailored interventions across three levels: Tier 1 focuses on classroom adjustments, Tier 2 involves small group instruction, and Tier 3 offers intensive, individualized support. The model serves as a replacement for traditional IQ-achievement discrepancy methods, aiming to accurately identify and effectively support students with reading difficulties.

E N D
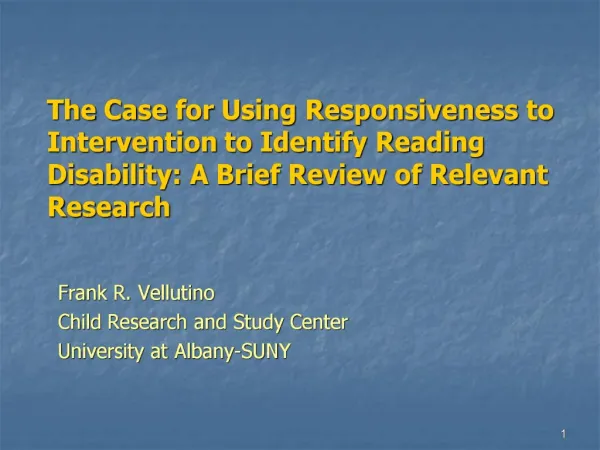
The Case for Using a Three Tiered Model for Reading Intervention Frank R. Vellutino Child Research and Study Center University at Albany-SUNY
Acknowledgements The studies conducted by Vellutino, Scanlon, and their associates were supported by grants funded through the National Institute of Child Health and Human Development, the U.S. Department of Education, and the National Science Foundation.
Definition of Responsiveness to Intervention (RTI) • RTI is a new approach to determining whether students should be classified as learning disabled. It involves: • Identifying students who are not meeting grade level expectations. • Providing remedial services that are intensified over several tiers of intervention. • Assessing students’ gains in the targeted academic area to determine whether they have accelerated their progress sufficiently to meet grade level expectations. • The RTI approach to identification of learning disability status is being offered as an alternative to traditional psychometric approaches to classification having the IQ-achievement discrepancy as the central defining criterion.
The Three Tiered Model of Intervention • Three sequentially ordered intervention strategies: • Tier 1—modification of classroom language arts instruction to assist children having learning difficulties. • Tier 2—secondary (small group) instruction for children whose learning difficulties are not resolved by modification in the classroom program. • Tier 3—more intensive and more individualized intervention (smaller groups, more sessions, one-to-one) for children at continued risk, despite Tier 1 and Tier 2 interventions.
How did RTI Emerge as a New Approach to LD Classification? • Over two decades of research undermining the use of the IQ-achievement discrepancy to define learning disabilities. • Well over a decade of intervention research documenting the utility of using an RTI approach to identifying learning disabilities in lieu of the IQ-achievement discrepancy. • IDEIA-2004.
Why do some children have difficulty learning to read ? • Two Broad Possibilities • Basic deficits in reading related cognitive abilities. • Experiential / Instructional deficits. • The failure to make this distinction leads to a wide spread problem: Misdiagnosing Children as “Disabled Readers.”
Psychometric Approach • Definition by Exclusion • IQ-Achievement discrepancy. • Sensory, physical, and emotional deficits, frequent absences from school, and socioeconomic disadvantage used as exclusionary criteria. • “Neuropsychological” tests of reading-related cognitive abilities. • Estimates of incidence of reading disability range from 10% to 20% using the above criteria.
The Psychometric Exclusionary Definition of Reading Disability: A Brief History
Kirk and Bateman (1962, 1963): • Learning disabilities are caused by neurodevelopmental disorders affecting academic learning in otherwise normal children. • Specific learning disabilities are different from general learning difficulties caused by low IQ, sensory, physical, or emotional deficits, or socioeconomic disadvantage.
Rutter and Yule (1975)—Isle of Wight Study • Large Scale epidemiological study of reading difficulties in U.K. • Percentage of children whose reading scores were significantly below those predicted by their ages and IQs was greater than expected (more than the 2.3% anticipated by a normal curve model). • Rutter & Yule distinguished between “Specific Reading Retardation” and “General Reading Backwardness” due to low intelligence.
Rutter and Yule’s (1975) Isle of Wight Study and Kirk and Bateman’s work became the basis for Public Law 94-142, which mandated that learning disabilities be defined as achievement deficits in otherwise normal children who have at least average intelligence. • P.L.- 94-142 led to the widespread use of psychometric exclusionary definitions of LD having the IQ-achievement discrepancy as its central defining criterion.
Contraindications to IQ-Achievement Discrepancy Definitions of Reading Disability
Several large scale studies have shown that: • IQ does not predict reading achievement with a high degree of accuracy (Malmquist, 1960). • Many IQ tests include items that depend on language and/or reading ability (e.g. vocabulary, general knowledge; Bond & Fay, 1950; Durrell, 1933). • Non-verbal IQ tests predict reading achievement with very low accuracy (Vellutino et al, 1994; 1996; 2000).
Rutter and Yule’s findings were not replicated in later research; their results were found to be due to measurement problems on the reading tests they used (Rodgers, 1983; Share et al., 1987). • Other studies found that: • IQ-achievement discrepant poor readers were no different than non-discrepant poor readers on measures of reading-related cognitive abilities (Fletcher et al., 1994; Stanovich and Siegel, 1994). • Also, that some good readers have IQ-achievement discrepancies. • Therefore the IQ-achievement discrepancy is not a very precise measure of reading disability.
Two important questions emerged from these findings: • To what degree can IQ set upper limits on and/or predict ability to learn to read? • To what degree can IQ scores predict response to remediation in struggling readers?
Can low IQ children learn to read? • Siegel (1988) compared reading disabled (n=250) and non-reading disabled children (n=719) on language and literacy skills (ages 7 to 16) and stratified these children into four IQ subgroups: IQ< 80; 80 to 90; 91 to 109; >110. • the non-disabled readers fell into the same IQ ranges as the disabled readers. • within each of the IQ ranges, the disabled readers performed below the non-disabled readers on language-based measures (e.g. phoneme awareness, verbal memory, etc.).
Share et al. (1989) stratified 3 year olds into different IQ subgroups and tracked reading growth in these children until age 13. • Siegel’s results were essentially replicated: disabled and non-disabled readers were found in each IQ subgroup. • IQ did not predict rate of growth in reading. • All of these studies provided evidence that measures of language and language-based skills are better predictors of reading ability than are IQ scores.
Siegel (1989) and others have also pointed out that: • Most intelligence tests currently in use evaluate acquired knowledge or cognitive abilities that can either be adversely affected by reading ability or adversely affect this ability. • Children who suffer from long-standing reading difficulties eventually become below average performers in areas such as vocabulary and syntactic knowledge, due to their limited ability to profit from reading (Stanovich, 1986; Vellutino et al., 1995).
Problems with the Psychometric Approach • No control for pre-school experiences and instruction • Low diagnostic validity of most tests • Rely primarily on IQ-achievement discrepancy • Too many children classified as “disabled readers” (10%-20%) • Low expectations for achievement • No direction for instruction • Little or no attention given to the quality and/or characteristics of instruction
First Grade Intervention Study (Vellutino et al., 1996) • Major Objectives • To distinguish between biologically-based cognitive causes and experiential/instructional causes of reading difficulties. • To compare responsiveness to intervention (RTI) vs. psychometric approaches to diagnosing reading disability. • To develop benchmarks for early identification of children at-risk for reading difficulties.
Major Components of the Study • Testing at the beginning of kindergarten to evaluate emergent literacy skills and reading-related cognitive abilities (n = 1407). • Periodic observation of language arts instruction in all kindergarten classrooms. • Selection of poor and normal readers in mid-first grade, using psychometric and exclusionary criteria like those used in public schools.
Major Components of the Study (Cont’) • Daily one-to-one tutoring for most of the poor readers (n=76). school-based remediation provided for the rest of them (n = 42). • Tutoring was highly individualized and comprehensive. • Compared four groups of poor readers (VLG, LG. GG, VGG) and two groups of normal readers (AvIQNorm, AbAvIQNorm). • First and third grade cognitive testing for all target children. • Progress in acquiring major reading skills was systematically evaluated from kindergarten through the end of fourth grade.
Approach to Instruction: Interactive Strategies ( Vellutino & Scanlon, 2002) • Components of Daily Tutoring • Re-reading texts for fluency • Phonological skills • Reading new texts • Sight word practice • Writing • Instruction designed to promote interactive use of text-based and code-based strategies in text reading
Major Findings • Struggling readers in first grade performed below average on kindergarten measures of emergent literacy skills. • The kindergarten language arts program was an influential determinant of first grade reading achievement. • The majority of tutored children (67%) scored in the average range after 15 weeks of daily one-one tutoring (50% for comparison group). • Only 15.8% scored below 15th percentile (1.5% of the population)
Major Findings (cont’) • IQ scores did not: • reliably differentiate struggling and normal readers. • predict response to intervention. • predict reading growth in normal readers. • Language-based measures, especially phonological measures did: • reliably differentiate struggling and normal readers. • reliably differentiate difficult to remediate and readily remediated tutored children.
Kindergarten and First Grade Intervention Study (Spring 1997-Spring 2002) • Major Objectives • Evaluate the utility of remedial intervention for “at risk” kindergarteners. • Further evaluate the RTI approach to identifying children at-risk for early and long-term reading difficulties.
At-Risk Children Kindergarten Not-at-Risk Children (n=898) Intervention (n=232) Comparison (n=230) K-intervention First grade Continued Risk No-Longer at-Risk Normal Readers First Grade Intervention Third grade Difficult to Remediate Less Difficult to Remediate No-Longer at-Risk Average IQ Above Average IQ
Kindergarten Screening N=1373 Letter identification (initial screening) Phonological awareness (rhyme and alliteration) RAN object naming Number identification Counting by 1’s 30% Kindergarten Intervention N= 462 Intervention n= 232 Small groups, 2-3 days, weekly, 30min sessions Comparison n=230 Small group instruction in some but not all schools Intervention and comparison groups were equivalent on all screening measures Phoneme Awareness Letter ID Letter-Sound Association Alphabetic Principle Print Awareness Print Conventions Whole Word Identification Text Reading Randomized Design
First Grade Intervention One-to-one Daily Tutoring Interactive Strategies Approach Third grade Cognitive Measures Rapid Naming (letter and objects) Confrontational Naming Verbal Memory Vocabulary Language Comprehension Verbal and Non-verbal Intelligence
Kindergarten Intervention • Project Treatment group performed significantly better than School-Based Comparison group on almost all emergent literacy measures at the end of kindergarten. • Effect sizes consistently larger in schools that provided no supplemental remedial services in kindergarten.
Figure 3. Effect sizes for intervention/comparison groups (end of Kindergarten, no school-based remediation)
First Grade Intervention • First Grade RTI Groups • Children who received both kindergarten and first grade intervention. • Difficult to Remediate (DR): < SS 90 on WRMT-R Basic Skills Cluster (BSC) at the end of third grade • Less Difficult to Remediate (LDR): SS 90 on WRMT-R BSC at the end of third grade • Comparison Groups • Children who received only kindergarten intervention and were no longer at risk (NLAR). • Normal reader controls (AvIQNorm, AbAvIQNorm).
Performance on Achievement Measures • NLAR and LDR groups performed within the average range and above the DR group on all literacy measures at the end of first, second and third grade (see handouts). • LDR group performed at levels comparable to NLAR group on all literacy measures at the end of first, second, and third grade. • DR group performed within the average or low average ranges on all literacy measures at the end of first grade, but fell below average on all measures over second and third grade.
84% of the at risk children became at least average level readers after receiving only kindergarten intervention or both kindergarten and first grade intervention. • Of those who became average level readers, 73% (72/98) received only kindergarten intervention. • Growth in kindergarten literacy skills predicted continued risk status at the beginning of first grade with 90% accuracy and no-longer-at risk status with 87% accuracy. • Adding a measure of change over the summer increased predictive accuracy to 95% for continued risk status and 96% for no-longer-at-risk status.
Results (contd’) • IQ tests did not predict end of second and third grade reading achievement following first grade intervention, but measures of growth in reading did do so. • IQ tests did not reliably differentiate continued risk, no-longer-at risk, and typical readers in first grade; verbal IQ did differentiate these groups in third grade, but non-verbal IQ did not reliably do so. • The continued risk children generally performed below the no-longer-at-risk and typical readers on measures of language-based skills.
A Comparison of Classroom (Tier 1) Intervention Versus Small Group (Tier 2) Intervention in Reducing the Number of Children at Risk for Early Reading Difficulties Scanlon, Vellutino, Gelzheiser, Dunsmore, Schatschneider, and others (study yet ongoing)
Research Questions • Can Classroom (Tier 1) Intervention be Effective in Preventing Early Reading Difficulties? • Can Professional Development Training Influence Teacher Effectiveness in Preventing Early Reading Difficulties?
Design • Participating schools (n = 14) were divided into three matched groups on the basis of SES of the population served, risk status of entering kindergartners, and performance on 4th grade measures of literacy skills in participating schools. • Each group of schools was randomly assigned to one of three treatment conditions: • Intervention Only: At risk kindergartners and first graders received remedial services provided by project teachers. • Professional Development Only: Summer workshop and in-school coaching along with ongoing discussion groups were provided for kindergarten and first grade teachers. • Both Intervention and Professional Development.
In each school, three cohorts of entering kindergartners (K-2002, K-2003, & K-2004) were followed until they reached second or third grade. Each cohort of children was treated differently: • Baseline Cohort – (K-2002-2003; n=718) - Data collection only • Implementation Cohort (K-2003-2004; n=728) - During Kindergarten and First Grade: • Professional Development Training (PD-Tier 1). • Project Interventions (K-Tier 2; Grade 1-Tier 3). • Both PD-Tier 1 and Project Interventions (K-Tier 2; Grade 1- Tier 3). • Maintenance Cohort (K-2004-2005; n=743). • Project-based support discontinued for all kindergarten and first grade classroom teachers who received professional development training (PD and PD+ PI). • Tier 2 and Tier 3 interventions continued for children in both PI only and PD + PI conditions.
Treatments • Kindergarten Small Group Intervention – as in previous Small Group-Tier 2 study discussed. • First Grade One-to-One Intervention – as in previous Tier 3 study discussed. • Professional Development for Teachers: • Summer workshops provided by project staff-(Kindergarten-3 days; First grade-4 days). • Interactive Strategies Approach was presented and discussed; heavy emphasis was also placed on the development of: • Oral language skills • Comprehension strategies • Ongoing support from project staff for implementation: • Monthly after school meetings focusing on the instructional foundations and goals discussed during the summer workshops and implementation in a variety of instructional settings. • In-class observation and feedback provided by master teachers (project staff) – five times during the implementation year.
Data Collected (All Cohorts) • Phonological Awareness Literacy Screening (PALS): beginning and end of kindergarten; beginning of first grade, and end of first, second, and third grade. • Word Identification and Word Attack-(Woodcock-Johnson Test of Achievement III): beginning and end of first grade; end of second and third grade. • Reading and Listening Comprehension (Wechsler Individual Achievement Test): end of first, second, and third grade. • Receptive Vocabulary-(Peabody Picture Vocabulary Test): kindergarten and end of first, second, and third grade. • Verbal Intelligence-Information and Vocabulary subtests: kindergarten and first grade (WPPSI) and end of second and third grade (WISC-III).
Data Collected (Continued) • Observations of classroom language arts instruction: five times a year for kindergarten and first grade. • Teacher questionnaires and interviews: once a year for kindergarten and first grade. • Assessment of teacher effectiveness in terms of reductions in the proportion of children who qualified as at risk for reading difficulties as determined by literacy tests administered at the beginning and end of the school year. • Teachers dichotomized into “Most Effective” and “Least Effective” groups were compared on classroom program and practices. • Note: All data used to compare most and least effective teachers were collected prior to determination of teacher effectiveness.
Preliminary Results: Kindergarten Teacher Effectiveness (Baseline Cohort) • Results suggest that the most effective kindergarten teachers, by themselves, can significantly reduce the number of at risk children who continue to be at risk from the beginning to the end of kindergarten. • The most effective kindergarten teachers differed from the least effective teachers primarily in their success at moving children from the at-risk group to the no-longer-at-risk group.
Note: The most effective K teachers differ primarily in their success at moving the at-risk kids.
Classroom Practices of Most Effective Teachers • Ability Grouping • Most Effective Teachers were more likely to group students by ability for reading instruction. • They also spent more time teaching small ability based groups. • Skills Orientation • Most Effective Teachers were more likely to explicitly teach decoding/encoding skills. • They also spent more time teaching reading subskills such as phonological awareness, letter identification, letter sound decoding, and sight word identification.