Colorimetry & Spectrophotometry
Colorimetry & Spectrophotometry. Useful Terminology. Colorimetry is the use of the human eye to determine the concentration of colored species. Spectrophotometry is the use of instruments to make the same measurements. It extends the range of possible measurements beyond

Colorimetry & Spectrophotometry
E N D
Presentation Transcript
Colorimetry & Spectrophotometry
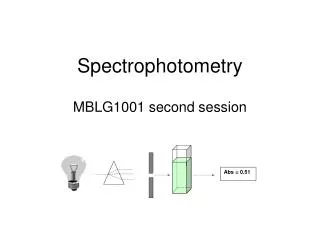
Useful Terminology • Colorimetry is the use of the human eye to determine the concentration of colored species. • Spectrophotometry is the use of instruments to make the same measurements. It extends the range of possible measurements beyond those that can be determined by the eye alone. Note: This experiment will demonstrate both techniques on the same set of dyes.
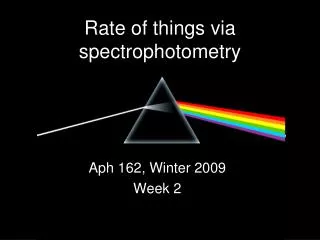
Colorimetry • Visual Observations – Because colorimetry is based on inspection of materials with the human eye, it is necessary to review aspects of visible light. • Visible light is the narrow range of electromagnetic waves with the wavelength of 400-700 nm. ROYG. BIV = the mnemonic used to remember the colors of the visible spectrum.
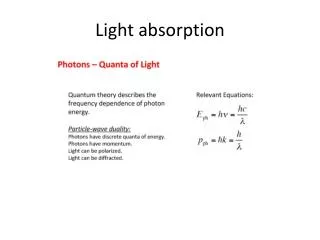
Visible light is only a very small portion of the electromagnetic spectrum. Note: Frequency (υ) and Energy (E) are directly proportional whereas Frequency (υ) and Wavelength (λ) are inversely proportional.
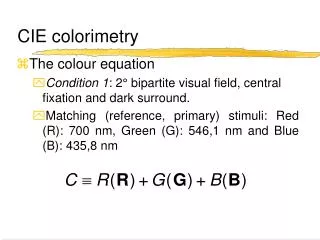
Electromagnetic radiation is characterized by its wavelength, , Frequency, and energy, E: E = h= hc / c = Where h = Planck’s constant & c = speed of light in a vacuum. longer wavelength, lower energy; shorter wavelength, higher energy.
Color Wheel (ROYGBIV) Complementary colorslie across the diameter on the color wheel and combine to form “white light”, so the color of a compound seen by the eye is the complement of the color of light absorbed by a colored compound; thus it completes the color.
Visual Colorimetry Intensity: For light shining through a colored solution,the observed intensity of the color is found to be dependent on both the thickness of the absorbing layer (pathlength) and the concentration of the colored species. ←Side view ←Top view (a.k.a. Bird’s eye view) For One Color: A series of solutions of a single color demonstrates the effect of either concentration or pathlength, depending on how it is viewed.
Visual Colorimetry ←Ratio used ←Purple produced For more than one color: the ratio of an unknown mixture can also be determined by matching the shade of the color to those produced from known ratios. In this example, the ratio of a mixture of red and blue can be determined visibly by comparing the mixture to purples produced from known ratios of red and blue.
Dilution Factor (constant pathlength) Recall: C1V1= C2V2 Then for the dilution, Cdiluted x Vdiluted=Cstdx Vstd Cdiluted= Cstdx(Vstd/ Vdiluted) Since Vdiluted = Vtotal Cdiluted = Cstd x (Vstd / Vtotal) Substituting the volumes: Cdiluted= Cstdx (3 drops / 8 drops) If the original concentration is 5.88 ppm, then: C diluted = 5.88 ppm x (3 / 8) C diluted= 2.21 ppm 3 drops of dye std + 5 drops water 8 drops total volume
Intensity: When the product of the concentration and the pathlength of any two solutions of a colored compound are the same, the same intensity or darkness of color is observed. Duboscq visual colorimeter Adjustable Path Lengths
Spectrophotometry • Spectrophotometer- an instrument that measures the amount of light absorbed, or the intensity of color at a given wavelength. • The intensity of color can be given a numerical value by comparing the amount of light prior to passing it through the sample and after passing through the sample. • These quantitative measurements of light absorbed are the Transmittance and the Absorbance.
Absorbance Beer-Lambert Law(a.k.a. Beer's law) - the linear relationship between absorbance and concentration of an absorbing species. A = abc A is the absorbance “a” is molar absorptivity in L/[(mole)(cm)] Also called “extinction coefficient” or “”; it is dependent on the material being studied. “b” is the path length in cm The diameter of the cuvette or sample holder which is the distance the light travels through the absorbing sample. “b” is a constant when the same size cuvette is used for all samples. “c” is the concentration of the sample in (mol/L) Main use of Beer’s Law is to determine the concentration of various solutions.
Transmittance is Related to Absorbance Transmittance is given by the equation: T = I/Io where I is the intensity of the light after it has gone through the sample & Io is the initial light intensity. Absorbance is related to the %T: A = -logT = -log(I/ Io)
Equation Summary T= (I/Io) = 10-A %T = (I/Io) x 100 A = -logT = log(1/T) Sample Calculation If %T = 95%, then A = log(100/95) = log(1/.95) = -log(.95) A = 0.02227 Note the scale for Absorbance: 9/10th of the scale is from 0-1 and 1/10th is from 1-2. For this reason, the spectrometers have been calibrated in % Transmittance and all readings will be taken in %Transmittance.
Spectronic 20 (a.k.a. Spec-20) • Spec-20 - A single-beam visible light spectrophotometer. • Tungsten filament lamp emits visible wavelengths of light. • Blank is inserted to adjust 100%Transmittance at each wavelength.
Simple Spectrophotometer Schematic • The lamp emits all colors of light (i.e., white light). • The monochromator selects one wavelength and that wavelength is sent through the sample. • The detector detects the wavelength of light that has passed through the sample. • The amplifier increases the signal so that it is easier to read against the background noise.
Spectronic 20 Instructions (Directions below will be available next to each instrument) Mode Knob (set to Trans) Digital Display Sample Chamber 1. With sample chamber empty, set desired wavelength then adjust to 0%T with right knob on front panel. 2. Insert blank solution, close lid and adjust 100%T with right knob on front panel. 3. Insertdye solutions, read and record %T values. 4. Change wavelength*, repeat steps 2-4. Filter Lever Wavelength Knob 0-100%T Knob *NOTE: The filtermust be changed periodically to coordinate with the wavelength range studied: blue (400-449),green (450-549) and orange (550-749).
Post Lab: 4 Plots of Absorption Data Plots similar to the 3 below will need to be generated using a computer program such as Excel. You will also need to make a plot of your unknown blue or red which will look similar to #1 or #2. #1 #2 #3
Checkout Visual PortionSpec-20s 1 - 12 well plate 5 - cuvettesin a 3 - 12 well strips* test tube rack 5 - Beral pipets** *2 of which need to be at least 9 wells long. **Don’t have to be returned. There aren’t enough Spec-20s for all groups. So 1/2 will start with the Spec-20s and 1/2 will start with the visual portion. Dyes - Located in Lab: Record Concentrations Blue std. = _____ ppm Red std. = _____ ppm Waste We are using FDA food dyes and distilled water.
For April 9-12 Turn In: Colorimetry & Spectrophotometrypp 51-58 + 4 Graphs Read Over: Antacid Analysis(pp 33-34) in Green Book & Dimensional Analysis #4-5 (pp 28-34in the first book).