Download
1 / 14
140 likes | 326 Views
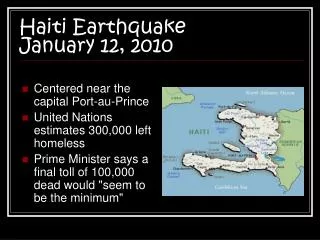
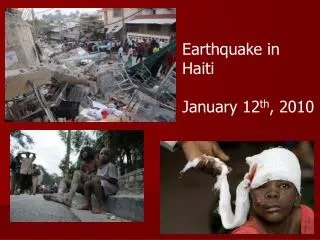
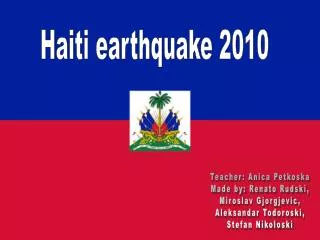
Analysis of LiDAR data during rapid scientific response to the January 12, 2010 Haiti earthquake. Eric Cowgill 1,2 , Tony Bernardin 2,3 , Mike Oskin 1,2 , Chris Bowles 1,2 , Burak Y ı kılmaz 1,2 , Oliver Kreylos 2,3 , Austin Elliott 1,2 , M. Scott Bishop 2,3 , Louise Kellogg 1,2.

E N D
Analysis of LiDAR data during rapid scientific response to the January 12, 2010 Haiti earthquake Eric Cowgill1,2, Tony Bernardin2,3, Mike Oskin1,2, Chris Bowles1,2, Burak Yıkılmaz1,2, Oliver Kreylos2,3, Austin Elliott1,2, M. Scott Bishop2,3, Louise Kellogg1,2 1 Geology, University of California, Davis 2 Keck Center for Active Visualization in Earth Sciences (KeckCAVES) 3 Computer Science, University of California, Davis
Lidar Viewer (Cloud) Steps: 1. Bare-earth DEMs in GIS & Crusta 2. Full point cloud in Lidar Viewer 3. Compare full & classified clouds 4. Visualize the classification 5. Manual classification 6. Crusta: Map landform offsets. Our Approach 2010 El Mayor Crusta (DEM) Also see: Oskin et al. #7-3: Sun. 10/31 8:35 am Ballroom 4 Gold et al. #71-8: Sun 10/31 3:15 pm, 705/707 Bernardin et al. #172-7: Tue 11/2 9:30 am, 702 Forte et al. #172-10: Tue 11/2 10:15 am, 702
Model for future events: Large Lidar footprint (850 km2). Rapid collection, processing, and data release. Context ? Research Questions: Was there surface rupture? Relation to historical cluster? Oct. 18, 1751 Nov. 21, 1751 June 3, 1770
Crusta Video 1 Step 1: Bare-earth DEMS in GIS & Crusta Search for surface rupture (2010 & older) Map active fault trace Example from 2010 Sierra El Mayor
Observations: Fault stepover. Evidence of past surface rupture. Offset landforms. Step 1: Results
Lidar Viewer Movie 1 Step 2: Point Cloud in Lidar Viewer Double check for rupture & search for old offsets. Reveals topographic detail from bare-earth DEM. Example from 2010 Sierra El Mayor
Results from point set comparison tool: Step 3: Compare Full & Classified Clouds Removed Ground No data
Were ground returns misclassified? Lidar Viewer Movie 2 Step 4: Visualize the Classification
Lidar Viewer Movie 3 Step 5: Manual Classification in CAVE Automated: Removed Ground No data Several hours per site Sites were 16,000 to 120,000 m2 Manual:
Crusta Movie 2 Step 6: Map & Measure Offsets in Crusta Virtual field work enables remote analysis
Step 6: Results Independent field data = our remote measurements Dumay: 6.6 m vs. 6.3 +0.9/-1.3 m
1. Image before event. 2. Image immediately (days) after event. 3. Locate rupture using Lidar Viewer. 4. Rapid (days) automated classification & DEM. 5. Difference pre- and post-event data. 6. Crusta: draft rupture maps & slip functions. 7. Lidar Viewer: evaluate classification; measure offsets 8. Iterate steps 6 & 7. Our Vision: Lidar Viewer (Cloud) Crusta (DEM) Remote analysis during rapid scientific response:
1. Image before event. 2. Image immediately (days) after event. 3. Locate rupture using Lidar Viewer. 4. Rapid (days) automated classification & DEM. 5. Difference pre- and post-event data. 6. Crusta: draft rupture maps & slip functions. 7. Lidar Viewer: evaluate classification; measure offsets 8. Iterate steps 6 & 7. Our Vision: Lidar Viewer (Cloud) Crusta (DEM) Remote analysis during rapid scientific response: Philosophy: rapidly release versions and then revise iteratively. Application of computational thinking: release early & release often.
Conclusion: New advanced methods of virtual-reality visualization transform rapid scientific response by enabling real-time interactive data analysis and virtual field work. Also see: Oskin et al. #7-3: Sun. 10/31 8:35 am Ballroom 4 Gold et al. #71-8: Sun 10/31 3:15 pm, 705/707 Bernardin et al. #172-7: Tue 11/2 9:30 am, 702 Forte et al. #172-10: Tue 11/2 10:15 am, 702