
The Future of Ecoinformatics: Enhancing Ecological Data Management and Analysis for the 21st Century
E N D
Presentation Transcript
Vision for the 21st Century Information Environment in Ecology (Ecoinformatics) Deana PenningtonUniversity of New MexicoLTER Network OfficeShawn BowersUCSDSan Diego Supercomputer Center
If georeferenced GIS Moderately large Complex formats Data Types Ecological Metadata Language (EML) ====== Field data Small Complex formats Heterogeneous Imagery Massive Simple formats Continuous spatial Spatial Data Workbench: Small NPACI project SEEK: large ITR project Ground sensors Massive Simple formats Continuous temporal Wireless Sensor Workshop NEON Observatories: question driven data collection
Hardware, networks Electronic notebooks Remote Sensing Wireless Sensors Metadata Databases & Query Web design Grid technologies Hardware, networks Electronic notebooks Remote Sensing Wireless Sensors Metadata Databases & Query Web design Grid technologies Hardware, networks Electronic notebooks Remote Sensing Wireless Sensors Metadata Databases & Query Web design Grid technologies Semantic mediation Data mining Exploratory spatial data analysis Pattern matching Visualization Semantic mediation Data mining Exploratory spatial data analysis Pattern matching Visualization Semantic mediation Data mining Exploratory spatial data analysis Pattern matching Visualization Processing Pipelines High-throughput processing Expert systems Processing Pipelines High-throughput processing Expert systems Computational Models Genetic algorithms Cellular automata Adaptive agents, et al. Computational Models Genetic algorithms Cellular automata Adaptive agents, et al. Processing Pipelines High-throughput processing Expert systems Computational Models Genetic algorithms Cellular automata Adaptive agents, et al. EML Spatial Data Workbench Wireless Sensors SEEK Workflows Analytical Domains: Information Acquisition, Archival & Retrieval Data Preprocessing & Product Creation Integrated Data Analysis & Synthesis Inference From Pattern Information Technologies:
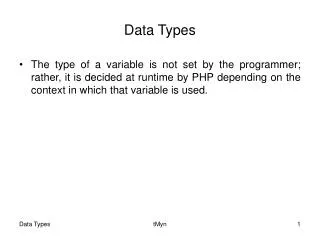
Satellite Images High GIS Weather Stations Data Volume (per dataset) Business Data Biodiversity Surveys Primary Productivity Population Data Gene Sequences Soil Cores Low High Complexity/Metadata Requirements Characteristics of Ecological Data Wireless Sensors SEEK Modified from B. Michener
Field Data: Semantics Modified from B. Michener, 2003
Remotely Sensed & Ground Data • Satellite Landsat since 1972 (multispectral) Ikonos (hyperspatial) Hyperion (hyperspectral) • Airborne Air photos (historical reconnaisance) Radar Thermal ADAR (multispectral) Aviris (hyperspectral) • Ground data Field data Automated sensors Wireless sensors Remotely sensed Target
Event t = 2 t = 1 Event A Event A Event A t t t Remotely sensed images capture information continuous space, which can then be compared through time to derive events Wireless sensors capture information at a continuous time, which can then be compared through space to derive spatial patterns
History Repeats Itself… “…use of remotely sensed data…lagged for many years. The reasons for this have little to do with the sophistication of remote sensing technology. Rather it has to do more with the ability to store, manage, access and use the massive data produced by satellites, radar facilities and other remote sensing instruments. Without advanced information processing, it would take decades to compile and analyze the incredible amounts of information that produced by many of these instruments.” -Dr. Rita Colwell, Director NSF, 1998
Environmental Cyberinfrastructure Needs for Distributed Sensor Networks: a Report from a NSF Sponsored Workshop (2003) • Sensors • Deployed Sensor Networks • Metadata • Security and Error Resiliency • Cyberinfrastructure for Sensor Networks • Analysis and Visualization • Education • Outreach • Collaboration and Partnering Information Acquisition, Archival & Retrieval Integrated Data Analysis & Synthesis Inference From Pattern Data Preprocessing & Product Creation
Incorporating IT Analytical Advances into Ecology Grid Technologies Knowledge Representation, Semantics and Ontologies
The Semantic Web Extend the current web with “knowledge” and “meaning” for Better searching (that is, better answers to current searches) Automated software tools that process web information (comparison shopping, making appointments, and so on) Proposes a new form of web content, which uses ontologies and knowledge representation techniques
The Semantic Web [Sci. Am., May ‘01, Berners-Lee] “Mom needs to see a specialist for a series of physical therapy sessions – can you take her?” Find physical therapist for mom using my schedule Return provider available within 10 miles of location get openings Semantic-Web Agent get possible providers and availability get locations get physician prescription
Semantic Web Architecture (RDF) The Resource Description Framework (RDF), which is a language to: • Define standard ontologies • Annotate web-pages with Semantic-Web content Ultimately, tools … to exploit semantic mark up Web-crawlers, search engines, personal agents
RDF / RDF Schema covers locatedAt worksAt Insurance Provider Physican Medical Facility Location An RDF Schema (or OWL) ontology Serves as a common set of terms (a vocabulary) with relationships and constraints Can be published as Web-content using RDF (for others to use) Physical Therapist
RDF / RDF Schema covers locatedAt worksAt Insurance Provider Physican Medical Facility Location With RDF, this Web-page can be annotated using the ontology Physical Therapist covers worksAt locatedAt BlueCross Dr. Hartman University Hospital 555 Univ. Drive …
RDF / RDF Schema Which Physical Therapists workAt a Facility within Location X? covers locatedAt worksAt Insurance Provider Physican Medical Facility Location Annotations provide access to the meaningful, or semantic content of the Web-page Physical Therapist covers worksAt locatedAt BlueCross Dr. Hartman University Hospital 555 Univ. Drive …
SEEK and the Semantic Web We want to build technology using Semantic-Web standards to … … explore the use of semantics to help scientists deal with heterogeneity • Define standard ecological ontologies • Automate dataset and analytic-step discovery, exchange, and integration • Help researchers construct and reuse scientific workflows, for example, for ecological modeling
Pipeline Pipeline SEEK EcoGrid • Question of interest • Query EcoGrid for workflows (ontologies) • Query EcoGrid for data (ontologies & semantic mediation) • SRB optimizes and runs analysis • Get results…archive to EcoGrid • Working Groups: • EcoGrid • Semantic mediation & KR • Analysis & Modeling • Taxon • BEAM • EOT 60 Gigabits/second Resources (data & computational) Managed by Storage Resource Broker (SRB)
Analytical Services Storage Resource Broker Matt Jones, 2003 Data Services (includes analytical libraries) EcoGrid • Node Registry • Web service: XML standards, SOAP/WSDL protocols • Data: REQUIRES standard metadata (EML and others) • Workflows: standard workflow metadata?
Overview of architecture SEEK Components
Benefits to Users • Scientists • Access to high end computing technologies • Better integration of all relevant data • Workflow standardization and analysis • Time and resource efficiency • Reusable analytical steps & workflows • Students Improved access to knowledge base • Environmental Managers Accessibility to current scientific approach • Policy makers Timely input to decision making • Formal documentation of methods (output in report format) • Reproducibility of methods • Visual creation and communication of methods • Versioning • Automated data typing and transformation
Test sample Species pres. & abs. points Species pres. & abs. points Model quality parameters Training sample GARP rule set PhysicalTransformation Data Calculation Sample Data EcoGrid Query Validation +A2 +A3 GARP rule set +A1 Integrated layers Native range prediction map User Map Generation Env. layers Integrated layers Selected prediction maps EcoGrid Query Layer Integration Scaling Archive To Ecogrid Generate Metadata SEEK: ENM workflows EcoGrid DataBase EcoGrid DataBase EcoGrid DataBase EcoGrid DataBase
Analytical Pipelines Sloan Digital Sky Project: Mapping the Universe “The raw data…are fed through data analysis software pipelines…to extract about 400 attributes for each celestial object…These pipelines embody much of mankind’s knowledge of astronomy.” Szalay et al., 2001
+A3 +A2 Interpolation Pipeline Acoustic Signal Processing Pipeline Image Processing Pipeline +A1 Remotely sensed data (land cover class, etc.) Ground sensor data (climate, etc.) Species Distribution Pipeline Test sample Species pres. & abs. points Species pres. & abs. points Model quality parameters Training sample GARP rule set PhysicalTransformation Data Calculation Sample Data Validation GARP rule set Integrated layers Native range prediction map User Map Generation Env. layers Integrated layers Selected prediction maps EcoGrid Query Layer Integration Scaling Archive To Ecogrid Generate Metadata
Analytical Pipelines: SDW SRB/ MCAT Radiometric Corrections Maps HPSS @ SDSC Remotely Sensed Imagery Georegistration Band Indices Data Transformation Unsupervised Classification Exploratory analysis Vegetation patterns Vegetation dynamics Model parameterization Site Field Observations Supervised Classification Segmentation Land Cover (Patch) Metrics Ground truth Band Selection Climate Climate/Land Cover Integrated Graphics
Brain atlas Registration Template Distance Transforms Statistical Classification Segmented images Prototypes Grey value images Biomedical Informatics Research Network Kikinis et al., 2001 T. Kapur, et al., 1998; Tina Kapur, 1999. Surgical Planning Laboratory, 2001
Society for Industrial and Applied Mathematics (SIAM) Conference on Imaging Science, 2004 CONFERENCE THEMES • Image acquisition • Image reconstruction and restoration • Image storage, compression, and retrieval • Image coding and transmission • PDEs in image filtering and processing • Image registration and warping • Image modeling and analysis • Statistical aspects of imaging • Wavelets and multiscale analysis • Multidimensional imaging sciences • Inverse problems in imaging sciences • Mathematics of visualization • Biomedical imaging • Applications “By their very nature, these challenges cut across the disciplines of physics, engineering, mathematics, biology, medicine, and statistics.” Why not ecology and environmental science?
Ontologies Astrophysics Ontology • Ecology Ontology • Landscape Ecology • Land Managers • Soil science • Etc. Generic Image/Signal Ontologies Digital Film Ontology Biomedical Ontology And many others…
Landscape Ecology Example Generic Image Ontologies Domain Ontologies Structural Ontologies Patch metrics Method Ontologies Pixel calc Classification Segmentation Atm Corr Land cover class Patch ID TM EMR 7 bands HDF Place/date Calibrations Physical Ontologies Modified from Camara et al. (2001)
So far…. • Grid Technology EcoGrid vs semantic web • Analytical pipelines/Workflows Sensors: generic vs domain specific Reuse of actors/workflows Workflow metadata and reporting • Ontologies/Semantic Mediation Query EcoGrid for workflows Query EcoGrid for data to fit the selected workflow(s) Integration of heterogenous data types
Data Mining-finding interesting patternsVisualization-showing interesting patterns Exploratory Data Analysis
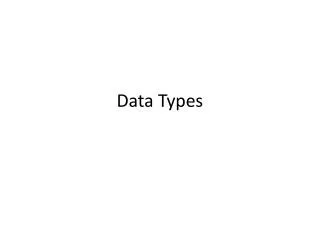
1989 90 91 92 93 94 95 96 97 98 99 00 01 2002 TM AVHRR MODIS NDVI at Sevilleta AVHRR: 1 x 1 km pixels, 14 years * 26 images/year * 1824 pixels = 663,936 data points TM: 30 x 30m pixels, 14 years * 2 images/year * 65,260 pixels = 1,827,280 data points if 20 images/year => 18,272,800 data points if 30 years => 39,156,000 data points
Spatiotemporal Analysis & Vis: Drought Effects 1999 2000 2001 2002 July 16-29 July 30-12 Aug 13-26 Aug 27-9 Sep 10-23
Linking and Brushing Visualization : Investigating cancer incidence and risk factors. From GeoVista Studio, Penn State University.
AVIRIS hyperspectral data cube > 50 gigabytes of raw data per acquisition Hyperspectral Imagery = 224 bands
Hyperspectral Example Pavement Riparian True Color Clouds Agriculture False Color Arid Upland River 300 pixels 6 km 300 pixels * 300 pixels * 224 bands = 20,160,000 data points
Training Samples Testing Samples Legend Label Error Land Cover Class Limited Set Clouds River Riparian Arid Upland Semi-arid Upland Pavement Agriculture Barren Full Set Limited Set: 192 training pixels, 7 mislabeled, out of 90,000 total pixels *low % training pixels *errors in training set
Supervised Classifiers Class 1 Support Vector Machine Hyperplane Class Means x Probability Contours Band 2 Class 2 Euclidean Distance Band 1 x Pixel to be classified
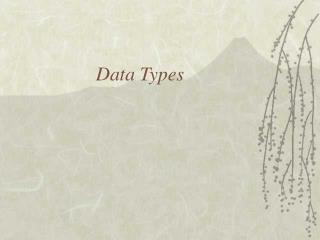
Limited Sample Set A) ML 89.4% B) NBN 83.3% Clouds River Riparian Agriculture Arid Upland Barren Pavement C) SVM 77.2% D) MD 69.4% ML = Maximum Likelihood NBN = Naïve Bayesian Network SVM = Support Vector Machine MD = Minimum Distance
Full Sample Set A) ML 96.4% B) NBN 90.9% Clouds River Riparian Agriculture Arid Upland Semi-arid Upland Barren Pavement C) SVM 72.9% D) MD 88.4% ML = Maximum Likelihood NBN = Naïve Bayesian Network SVM = Support Vector Machine MD = Minimum Distance
Data Mining Challenges Biomedical Data • Large sample sets • Few correlates (dozens) • Hard classes Ecologic Data • Paucity of accurate reference data • Spatial autocorrelation • Large number of potential correlates • Fuzzy classes • Uncertainty
Basic Research Need • Spatiotemporal analysis & visualization techniques that explicitly deal with these challenges • EcoGrid archive of ground truth data and the ontologies that will allow us to semantically mediate the classes
Where do we start? Field data SEEK: infrastructure Imagery Spatial Data Workbench: Small NPACI project Ground sensors Wireless Sensor Workshop
Archive To Ecogrid Semantic transformation to integrate field data SRB/ MCAT Radiometric Corrections Maps HPSS @ SDSC Remotely Sensed Imagery Georegistration Band Indices EcoGrid Query Validation Data Calculation Map Generation User Pipeline Pipeline Sample Data Unspecified ground sensor pipeline Data Transformation Unsupervised Classification Models Competition Connectivity Climate Urban expansion Et al. + Generate Metadata Layer Integration Supervised Classification Segmentation Land Cover (Patch) Metrics Site Field Observations Ground truth Band Selection Climate Climate/Land Cover Integrated Graphics Domain Ontologies Geographic Ontologies Algorithm Ontologies Signal Processing Ontologies Image Ontologies Spatial & Temporal Ontologies Future Systems: Link with SEEK
Data Sharing Metadata Databases Computer savvy We start with you!
Incorporating sensor processing • Build a generic image and signal processing knowledge base • Develop actors for these functions • Build knowledge bases for domains of interest, and relate them to the generic • ENM pipelines • NEON competition • Hazards (fire, flood, drought, disease) • Develop processing pipelines • Identify sensor (image and signal) data and analytical resources, convert them to web services • When EcoGrid is ready, register them as nodes
National Center? • Multidisciplinary staff • Working groups (4-6 weeks) • Multidisciplinary postdocs • Summer school in ecoinformatics